Unlock a world of possibilities! Login now and discover the exclusive benefits awaiting you.
- Qlik Community
- :
- All Forums
- :
- QlikView App Dev
- :
- Re: Creation of Line chart
- Subscribe to RSS Feed
- Mark Topic as New
- Mark Topic as Read
- Float this Topic for Current User
- Bookmark
- Subscribe
- Mute
- Printer Friendly Page
- Mark as New
- Bookmark
- Subscribe
- Mute
- Subscribe to RSS Feed
- Permalink
- Report Inappropriate Content
Creation of Line chart
Hi
I'm having difficulty creating a line chart with my data.
I have the following twelve fields that have a value and each field relates to a month ( See Below)
WOG001 = £100
WOG002 = £150
WOG003 = £300
And so on through to 012
I want to create a line chart that accumulates the fields for each period
Period 1 = WOG001 = £100
Period 2 = WOG001 + WOG002 = £200
And so on
At the moment the data set does not contain a year or period field and I'm having trouble working out how I can create a line chart that has year and period on the horizontal and value as the vertical. The fields above only contain a value and it is the field itself that defines that it relates to a particular period.
- Tags:
- qlikview_scripting
- « Previous Replies
-
- 1
- 2
- Next Replies »
- Mark as New
- Bookmark
- Subscribe
- Mute
- Subscribe to RSS Feed
- Permalink
- Report Inappropriate Content
It looked that you have some kind of a crosstable what might be transformed, see: The Crosstable Load. Please post more details from script and tableviewer.
- Marcus
- Mark as New
- Bookmark
- Subscribe
- Mute
- Subscribe to RSS Feed
- Permalink
- Report Inappropriate Content
LOAD
WOG001,
WOG002,
WOG003,
WOG004,
WOG005,
WOG006,
WOG007,
WOG008,
WOG009,
WOG010,
WOG011,
WOG012,
WOG013,
WOG014,
WOG015,
WOG016
FROM
(qvd);
- Mark as New
- Bookmark
- Subscribe
- Mute
- Subscribe to RSS Feed
- Permalink
- Report Inappropriate Content
Hi Andrew,
If you are having these provied fields in your data model we can create a line chart like this,
Back end :
Table:
LOAD *,
ID & Value as Period,
AutoNumber(ID & Value,1) as PeriodNumber


INLINE [
ID,Value
WOG001 , 100
WOG002 , 150
WOG003 , 100
WOG004 , 150
WOG005 , 300
WOG006 , 150
WOG007 , 300
WOG008 , 150
WOG009 , 300
];
Front End :
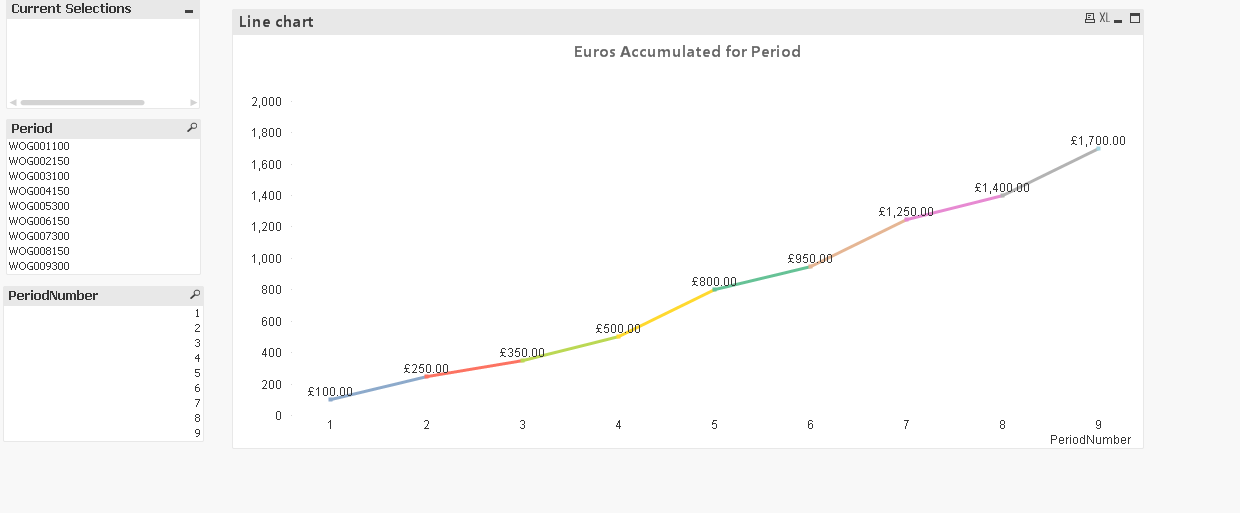
PFA for above Output.
Or else
If you need chart with month,Year more info by using a date field we can do it this way .
| ID | jan 2015 | Feb 2015 | jan 2016 | Feb 2016 |
|---|---|---|---|---|
| WOG001 | 2 | 4 | 7 | 8 |
| WOG001 | 3 | 6 | 8 | 7 |
We can use cross table for it,
Crosstable(Date(Jan 2015,..),Values,1)
Hope this helps,
Thanks,
Hirish.
“Aspire to Inspire before we Expire!”
- Mark as New
- Bookmark
- Subscribe
- Mute
- Subscribe to RSS Feed
- Permalink
- Report Inappropriate Content
Hi,
Can You post your sample qvd with ID,Values and periods.
-Hirish
“Aspire to Inspire before we Expire!”
- Mark as New
- Bookmark
- Subscribe
- Mute
- Subscribe to RSS Feed
- Permalink
- Report Inappropriate Content
Try something like this:
t1:
CrossTable(Periode, Value)
LOAD
'Dummy' as Dummy,
WOG001,
WOG002,
WOG003,
WOG004,
WOG005,
WOG006,
WOG007,
WOG008,
WOG009,
WOG010,
WOG011,
WOG012,
WOG013,
WOG014,
WOG015,
WOG016
FROM
(qvd);
t2:
Load Periode, Value, rangesum(peek('kum'), Value) as kum, rowno() as RowNo Resident t1;
drop table t1;
You might need further adjustments on the period and the cumulation don't need to be done within the script - with functions like:
rangesum(above(sum(value), 0, rowno(total)))
could this be done within the chart.
- Marcus
- Mark as New
- Bookmark
- Subscribe
- Mute
- Subscribe to RSS Feed
- Permalink
- Report Inappropriate Content
Hi
Thanks
he WOG fields contain a value so I would create
WOG001 As Period1Value
Etc
In the example above you have given each field a value
WOG001 , 100
So still a bit lost.
- Mark as New
- Bookmark
- Subscribe
- Mute
- Subscribe to RSS Feed
- Permalink
- Report Inappropriate Content
Ok Fine  .
.
In the above example you can see period number generated by that you can denote ID in order .
Hope that helps,
-Hirish
“Aspire to Inspire before we Expire!”
- Mark as New
- Bookmark
- Subscribe
- Mute
- Subscribe to RSS Feed
- Permalink
- Report Inappropriate Content
Hi Andrew,
have a look at the attached, using Crosstable as per Marcus, but with full accumulation on the Expressions tab of chart properties, for simplicity the value of 100 is applied for each WOG.
Andy
- Mark as New
- Bookmark
- Subscribe
- Mute
- Subscribe to RSS Feed
- Permalink
- Report Inappropriate Content
Hi
But my values are within the field itself. From what I understand you are loading the values in the INLINE load.
I get the period number creation but don't know how to accumulate the values in the WOG fields 1 to 12
- « Previous Replies
-
- 1
- 2
- Next Replies »