Unlock a world of possibilities! Login now and discover the exclusive benefits awaiting you.
- Qlik Community
- :
- All Forums
- :
- QlikView App Dev
- :
- Cyclic Groups and un-accumulated %
- Subscribe to RSS Feed
- Mark Topic as New
- Mark Topic as Read
- Float this Topic for Current User
- Bookmark
- Subscribe
- Mute
- Printer Friendly Page
- Mark as New
- Bookmark
- Subscribe
- Mute
- Subscribe to RSS Feed
- Permalink
- Report Inappropriate Content
Cyclic Groups and un-accumulated %
I am trying to incorporate a cyclic group for my dimension in the chart below. However, when I cycle through the group, which is defined based on different time frames such as on an annual, monthly, and quarterly basis, each time frame cumulates my expressions.
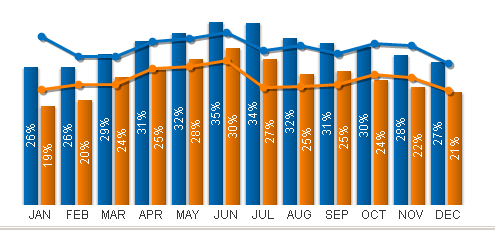
Example Chart: Unfiltered
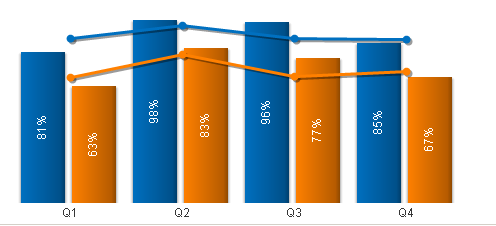
Example Chart: Filtered
How can I make it so when I drill down, quarterly values displayed are not cumulative?
Accepted Solutions
- Mark as New
- Bookmark
- Subscribe
- Mute
- Subscribe to RSS Feed
- Permalink
- Report Inappropriate Content
What expression are you using?
I would something like this:
Avg(Aggr(YourExpression, Monthly))
But to offer more help, need to know more details.
Best,
Sunny
- Mark as New
- Bookmark
- Subscribe
- Mute
- Subscribe to RSS Feed
- Permalink
- Report Inappropriate Content
What expression are you using?
I would something like this:
Avg(Aggr(YourExpression, Monthly))
But to offer more help, need to know more details.
Best,
Sunny
- Mark as New
- Bookmark
- Subscribe
- Mute
- Subscribe to RSS Feed
- Permalink
- Report Inappropriate Content
Opted for AVG() instead of SUM(). Thanks sunindia, again!
- Mark as New
- Bookmark
- Subscribe
- Mute
- Subscribe to RSS Feed
- Permalink
- Report Inappropriate Content
No problem 
I am glad we were able to figure it out.
Best,
Sunny