Unlock a world of possibilities! Login now and discover the exclusive benefits awaiting you.
- Qlik Community
- :
- All Forums
- :
- QlikView App Dev
- :
- Re: DLP optimization - not accaptable query execut...
- Subscribe to RSS Feed
- Mark Topic as New
- Mark Topic as Read
- Float this Topic for Current User
- Bookmark
- Subscribe
- Mute
- Printer Friendly Page
- Mark as New
- Bookmark
- Subscribe
- Mute
- Subscribe to RSS Feed
- Permalink
- Report Inappropriate Content
DLP optimization - not accaptable query execution time
Hello
I've build a report, but unfortunatly the query execution time is just too long - over one minute.
I've tried already to optimize the model, but without any success.
The biggest table I have is about 500'000'000 rows. And I have tested following models:
Model1
Model2: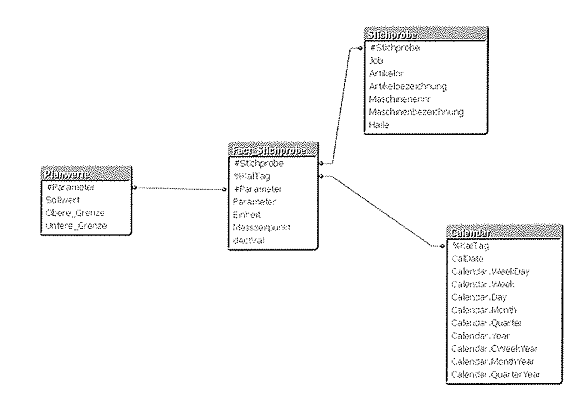
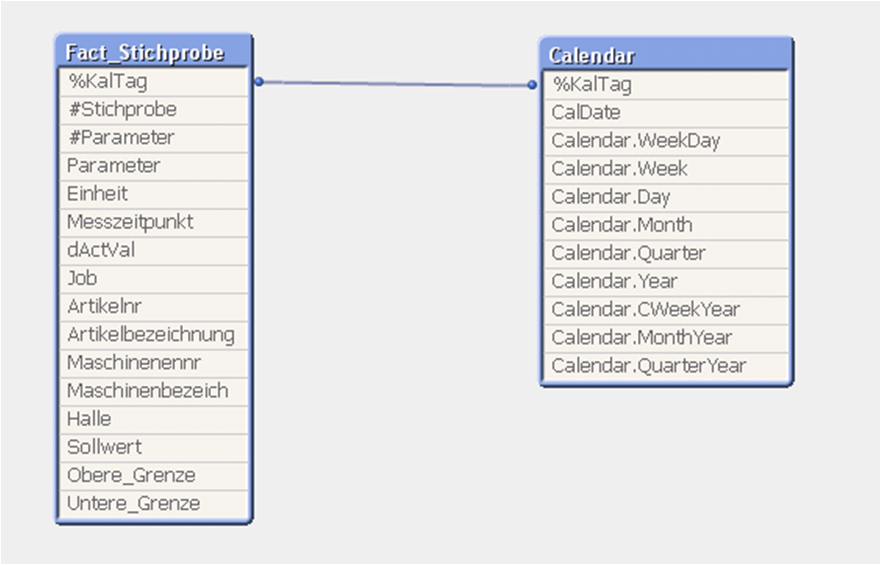
The last thing which might help is to join calendar to the fact table...
Otherwise I see only the way to split the table in different parts and create different reports.
Actually I did it already and split it in years, but the execution time is only acceptable when I split it in 4 month periods (execution time around 8 sec).
What can I do in order to optimize the model/report/execution time???
Any ideas?
cheers chesterluck
Accepted Solutions
- Mark as New
- Bookmark
- Subscribe
- Mute
- Subscribe to RSS Feed
- Permalink
- Report Inappropriate Content
Hi,
Yes it will sure help.
Try to transfer all your calculations which you are doing at chart level to script.
Also make sure that you are not using the count(),Count(if...), sum(if...), if(..,count())... statements in charts.
this are listed a extreme resource intensive functions.
Regards,
Kaushik solanki
- Mark as New
- Bookmark
- Subscribe
- Mute
- Subscribe to RSS Feed
- Permalink
- Report Inappropriate Content
Hi chesterluck,
Maybe the long execution time lies on the front end side of things with complex expressions?
Any specific objects or metrics that take a long time to calculate?
What kind of hardware are you running this huge app on?
- Mark as New
- Bookmark
- Subscribe
- Mute
- Subscribe to RSS Feed
- Permalink
- Report Inappropriate Content
Hi Johannes
I dont think its because of the front end. There is only one diagramm with xAxis= MeasureTimeStamp and yAxis=ActualValue.
The explained data is data from production-machines and its huge because every part produced brings a lot of parameterdata along with it.
Hardware: Intel® Xeon® Processor E5645 @2.4 Ghz @2.4 Ghz (6Core) And 16 gb RAM
cheers chesterluck
- Mark as New
- Bookmark
- Subscribe
- Mute
- Subscribe to RSS Feed
- Permalink
- Report Inappropriate Content
Oh, ok, so when you say "query execution time" you refer to the time it takes to run the script when hitting reload?
Or do you mean the time it takes for the chart to calculate in the front end?
- Mark as New
- Bookmark
- Subscribe
- Mute
- Subscribe to RSS Feed
- Permalink
- Report Inappropriate Content
Well basically both are taking too long, but im referring to the 2nd issue:
The chart calculation takes too long
Cheers chesterluck
- Mark as New
- Bookmark
- Subscribe
- Mute
- Subscribe to RSS Feed
- Permalink
- Report Inappropriate Content
While searching through some similar threads I found a document analyzer:
http://robwunderlich.com/Download.html
And I've executed it on the document. Hope it helps:
| Class | Type | SubType | Id | Count | Size | Bytes |
| 2055203321 | ||||||
| Database | Table | Records | Fact_Stichprobe | 119007943 | 13 | 1547103259 |
| Database | Table | Records | Stichprobe | 19962574 | 10 | 199625740 |
| Database | Field | Symbols | #Stichprobe | 18184573 | 8 | 145476584 |
| Database | Field | Symbols | Messzeitpunkt | 13925750 | 8 | 111406000 |
| State Space | Field State | State | #Stichprobe | 1 | 18184573 | 18184573 |
| State Space | Table State | Internal | Fact_Stichprobe | 14876000 | ||
| State Space | Field State | State | Messzeitpunkt | 1 | 13925750 | 13925750 |
| State Space | Table State | Internal | Stichprobe | 2495328 | ||
| Database | Field | Symbols | dActVal | 105026 | 8 | 840208 |
| Sheetobject | ListBox | Internal | Document\LB12 | 840208 | ||
| Sheetobject | StraightTableBox | Internal | Document\CH07 | 151976 | ||
| State Space | Field State | State | dActVal | 1 | 105026 | 105026 |
| Database | Field | Symbols | Job | 2451 | 17.02 | 41706 |
- Mark as New
- Bookmark
- Subscribe
- Mute
- Subscribe to RSS Feed
- Permalink
- Report Inappropriate Content
Please verify the following idea:
The main problems are fields Stichprobe (number of a sample) and Messzeitpunkt (timestamp).
What I can do is:
1) Format the Messzeitpunkt already in the DLP. (Until now I'm formating it in the diagramm
Time(Messzeitpunkt, 'YYYY.MM.DD hh:mm')
)
2) Stichprobe is just a number and anyhow we are not searching for it. It is also not unique as it contans also sample measurement numbers. So basically I can at the end just leave it out.
3) In case I cant leace the Stichprobe out - I can create an autonumber...
What do you think - will it help?
- Mark as New
- Bookmark
- Subscribe
- Mute
- Subscribe to RSS Feed
- Permalink
- Report Inappropriate Content
Hi,
Yes it will sure help.
Try to transfer all your calculations which you are doing at chart level to script.
Also make sure that you are not using the count(),Count(if...), sum(if...), if(..,count())... statements in charts.
this are listed a extreme resource intensive functions.
Regards,
Kaushik solanki