Unlock a world of possibilities! Login now and discover the exclusive benefits awaiting you.
- Qlik Community
- :
- All Forums
- :
- QlikView App Dev
- :
- Data Modeling Problem: How to show field values in...
- Subscribe to RSS Feed
- Mark Topic as New
- Mark Topic as Read
- Float this Topic for Current User
- Bookmark
- Subscribe
- Mute
- Printer Friendly Page
- Mark as New
- Bookmark
- Subscribe
- Mute
- Subscribe to RSS Feed
- Permalink
- Report Inappropriate Content
Data Modeling Problem: How to show field values in a chart from 3 different tables over a "generic" dimension (e.g. time)?
Dear all,
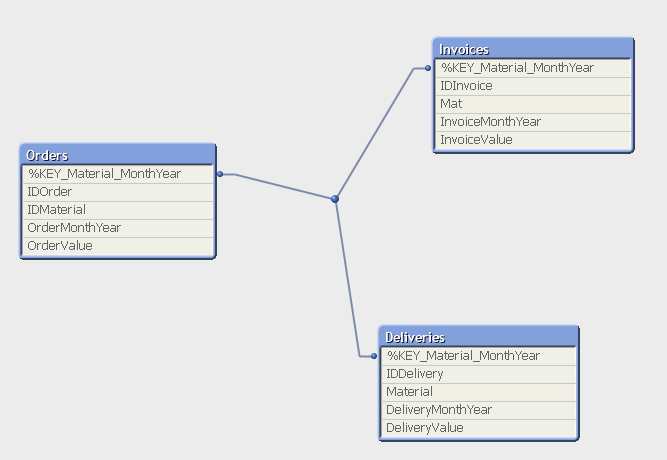
I created the following data model, containing the sales process from Order -> Delivery -> Invoice:
This is the script. DateFormat has been set to 'MM-YYYY':
// Table 1: Orders
Orders:
LOAD * INLINE [
%KEY_Material_MonthYear, IDOrder, IDMaterial, OrderMonthYear, OrderValue
Mat1|10-2017, O1, Mat1, 10-2017, 1
Mat2|11-2017, O2, Mat2, 11-2017, 2
Mat1|12-2017, O3, Mat1, 12-2017, 1
Mat2|12-2017, O4, Mat2, 12-2017, 3
];
// Table 2: Deliveries
Deliveries:
LOAD * INLINE [
%KEY_Material_MonthYear, IDDelivery, Material, DeliveryMonthYear, DeliveryValue
Mat1|10-2017, D1, Mat1, 10-2017, 1
Mat2|11-2017, D2, Mat2, 11-2017, 2
Mat1|12-2017, D3, Mat1, 12-2017, 1
Mat2|12-2017, D4, Mat2, 12-2017, 3
Mat3|01-2018, D5, Mat3, 01-2018, 1
];
// Table 3: Invoices
Invoices:
LOAD * INLINE [
%KEY_Material_MonthYear, IDInvoice, Mat, InvoiceMonthYear, InvoiceValue
Mat2|11-2017, I2, Mat2, 11-2017, 2
Mat1|12-2017, I3, Mat1, 12-2017, 1
Mat2|12-2017, I4, Mat2, 12-2017, 3
Mat3|01-2018, I5, Mat3, 01-2018, 1
];
The 3 tables are connected by a concatenaed key from the respective material + date of the transaction type (order / delivery / invoice). As you can see, the 3 fields "IDMaterial", "Material" and "Mat" are the same. They had to be renamed in order to avoid auto-key-building. Maybe this is already a flaw in my data model.
When I display the values in single charts (one per table), it is correct:

However, I want to to create ONE chart with the "generic" dimension "MonthYear" (irrespective of the transaction type) and all 3 expressions "OrderValue", "DeliveryValue" and "InvoiceValue". But I do not have this generic dimension that is associated with all 3 tables. I only have one distinct "MonthYear" field in every table. If I try to show the values over one of these fields, there naturally is a problem. For example, in the "Order" table, there are only values for 10-2017 till 12-2017. But there are a delivery and and invoice in 01-2018. As 01-2018 does not exist in the OrderMonthYear dimension values, it is "null":

My question ist: How can I create an "integrated MonthYear" dimension which can collect ALL order, delivery and invoice values?
I think you can do it a) in the data model by creating an aggregation table or b) in the layout with some expression. But I do not know how. In solution a) there would also be the problem that I would have all the values per MonthYear, yes. But then I lose the connection to the Material which also has to be applicable as a filter.
Please find attached the QVW. Thank you very much for your help in advance.
- Mark as New
- Bookmark
- Subscribe
- Mute
- Subscribe to RSS Feed
- Permalink
- Report Inappropriate Content
IMO your datamodel
"containing the sales process from Order -> Delivery -> Invoice"
couldn't work. Because linking them over the different date-fields from the tables and the Material don't lead to a sensible datamodel. I suggest a linking over the OrderID and Material is outsourced within a dimension-table and maybe linked to the order-table. To get rid of the different date-fields isn't easy because you need something like: Canonical Date.
- Marcus