Unlock a world of possibilities! Login now and discover the exclusive benefits awaiting you.
- Qlik Community
- :
- All Forums
- :
- QlikView App Dev
- :
- Re: Datamodel help ???
- Subscribe to RSS Feed
- Mark Topic as New
- Mark Topic as Read
- Float this Topic for Current User
- Bookmark
- Subscribe
- Mute
- Printer Friendly Page
- Mark as New
- Bookmark
- Subscribe
- Mute
- Subscribe to RSS Feed
- Permalink
- Report Inappropriate Content
Datamodel help ???
Hello Experts,
This Finance requirement is somehow complicated , but I'm sure I will get some help.
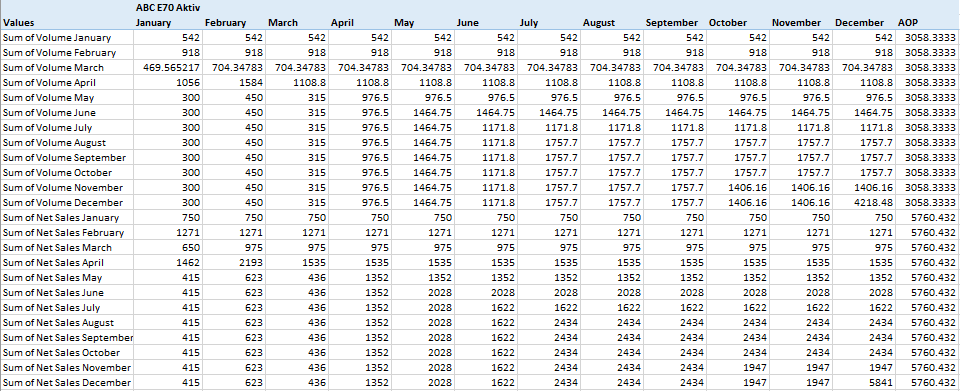
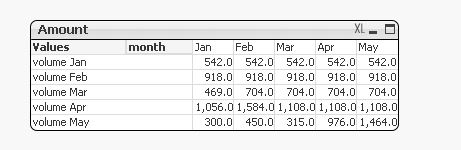
Data Source looks like below (Refer Source_Data Tab in attachment)

Not sure how can I deal with Month , Volume Months.....and Net Sales Month by using cross table or some other function.
Target Result required: (Refer Result tab in attachment)
Thanks in advance!
AS
- Tags:
- qlikview_scripting
- Mark as New
- Bookmark
- Subscribe
- Mute
- Subscribe to RSS Feed
- Permalink
- Report Inappropriate Content
Any Suggestion???
Thanks,
AS
- Mark as New
- Bookmark
- Subscribe
- Mute
- Subscribe to RSS Feed
- Permalink
- Report Inappropriate Content
Is it possible to share the Excel, It seems Transpose only. I don't think how much complex it is
- Mark as New
- Bookmark
- Subscribe
- Mute
- Subscribe to RSS Feed
- Permalink
- Report Inappropriate Content
PFA
- Mark as New
- Bookmark
- Subscribe
- Mute
- Subscribe to RSS Feed
- Permalink
- Report Inappropriate Content
Hi Amit,
I have an idea for the above result to be produced.
Attached the qvw, Kindly go through it.
If it is the same as you expected, you can use it.
Regards,
Vivek
- Mark as New
- Bookmark
- Subscribe
- Mute
- Subscribe to RSS Feed
- Permalink
- Report Inappropriate Content
May be look this
CrossTable([Month-Names], Sales, 4)
LOAD * FROM
(ooxml, embedded labels, table is Source_Data);
And then Create Pivot Table with the Dimension as
Dim1 ='Sum Of ' & [Month-Names]
Dim2 = Month
Expression is Simple
Sum(Sales)
And then Transpose Month as Vertical - Horizontal. Then Sort where ever you need
- Mark as New
- Bookmark
- Subscribe
- Mute
- Subscribe to RSS Feed
- Permalink
- Report Inappropriate Content
Hi Amit,
Please find attached result QVW file, hope this will be working for you're a requirement.Thank you.
Regards,
Suresh Sindhigi