Unlock a world of possibilities! Login now and discover the exclusive benefits awaiting you.
- Qlik Community
- :
- All Forums
- :
- QlikView App Dev
- :
- Re: Dimensions for Week over Week comparison in a ...
- Subscribe to RSS Feed
- Mark Topic as New
- Mark Topic as Read
- Float this Topic for Current User
- Bookmark
- Subscribe
- Mute
- Printer Friendly Page
- Mark as New
- Bookmark
- Subscribe
- Mute
- Subscribe to RSS Feed
- Permalink
- Report Inappropriate Content
Dimensions for Week over Week comparison in a Bar Chart
Hello,
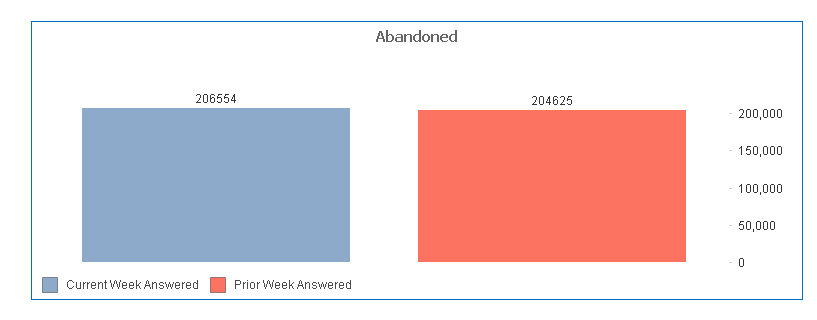
I am am creating a bar chat showing a Week over Week comparison. My Expression 1 was created to only show data for the current week. The second expression was created to only show data for the prior week.
However, I have my x-axis as CC_Week and it does not show the week number. I have also tried to change out the dimension for Week(CC_Date), but that does not seem to work as well. Please see my expressions below:
Current Week:
=Sum({1<CC_Date = {">=$(=Date(WeekStart(Max(CC_Date)), 'M/D/YYYY'))
<=$(=Date(WeekEnd(Max(CC_Date)), 'M/D/YYYY'))"}>} [Answered])
Prior Week:
=Sum({1<CC_Date = {">=$(=Date(WeekStart(Max(CC_Date),-1), 'M/D/YYYY'))
<=$(=Date(WeekEnd(Max(CC_Date),-1), 'M/D/YYYY'))"}>} [Answered])
I would think that my final result would show two dates (or week numbers) on the x-axis.
- Tags:
- qlikview_scripting
Accepted Solutions
- Mark as New
- Bookmark
- Subscribe
- Mute
- Subscribe to RSS Feed
- Permalink
- Report Inappropriate Content
Of course I can! 
Your dimension would be:
Valuelist("Current Week", "Prior Week")
Your expression would be:
pick(Rowno(),
Sum({1<CC_Date = {">=$(=Date(WeekStart(Max(CC_Date)), 'M/D/YYYY'))
<=$(=Date(WeekEnd(Max(CC_Date)), 'M/D/YYYY'))"}>} [Answered]),
Sum({1<CC_Date = {">=$(=Date(WeekStart(Max(CC_Date),-1), 'M/D/YYYY'))
<=$(=Date(WeekEnd(Max(CC_Date),-1), 'M/D/YYYY'))"}>} [Answered])
)
The structure is:
Pick(Rowno(),
first_expression,
second_expression
)
if you have more than 2 expression, just write them, don't forget the "," at the end
- Mark as New
- Bookmark
- Subscribe
- Mute
- Subscribe to RSS Feed
- Permalink
- Report Inappropriate Content
Can you show the image of what you have right now?
- Mark as New
- Bookmark
- Subscribe
- Mute
- Subscribe to RSS Feed
- Permalink
- Report Inappropriate Content
- Mark as New
- Bookmark
- Subscribe
- Mute
- Subscribe to RSS Feed
- Permalink
- Report Inappropriate Content
So you want to show the week number on the axis? That is what is missing?
- Mark as New
- Bookmark
- Subscribe
- Mute
- Subscribe to RSS Feed
- Permalink
- Report Inappropriate Content
You can use "value list" as a calculated dimension, and a function "pick".
See the img and qvw
Edit: You can also use variables or expressions on value list
- Mark as New
- Bookmark
- Subscribe
- Mute
- Subscribe to RSS Feed
- Permalink
- Report Inappropriate Content
yes that is correct
- Mark as New
- Bookmark
- Subscribe
- Mute
- Subscribe to RSS Feed
- Permalink
- Report Inappropriate Content
My current expressions are:
Current Week:
=Sum({1<CC_Date = {">=$(=Date(WeekStart(Max(CC_Date)), 'M/D/YYYY'))
<=$(=Date(WeekEnd(Max(CC_Date)), 'M/D/YYYY'))"}>} [Answered])
Prior Week:
=Sum({1<CC_Date = {">=$(=Date(WeekStart(Max(CC_Date),-1), 'M/D/YYYY'))
<=$(=Date(WeekEnd(Max(CC_Date),-1), 'M/D/YYYY'))"}>} [Answered])
Can you assist me in how I would add the Pick(RowNo(), to the above?
Thanks!
- Mark as New
- Bookmark
- Subscribe
- Mute
- Subscribe to RSS Feed
- Permalink
- Report Inappropriate Content
Of course I can!
Your dimension would be:
Valuelist("Current Week", "Prior Week")
Your expression would be:
pick(Rowno(),
Sum({1<CC_Date = {">=$(=Date(WeekStart(Max(CC_Date)), 'M/D/YYYY'))
<=$(=Date(WeekEnd(Max(CC_Date)), 'M/D/YYYY'))"}>} [Answered]),
Sum({1<CC_Date = {">=$(=Date(WeekStart(Max(CC_Date),-1), 'M/D/YYYY'))
<=$(=Date(WeekEnd(Max(CC_Date),-1), 'M/D/YYYY'))"}>} [Answered])
)
The structure is:
Pick(Rowno(),
first_expression,
second_expression
)
if you have more than 2 expression, just write them, don't forget the "," at the end