Unlock a world of possibilities! Login now and discover the exclusive benefits awaiting you.
- Qlik Community
- :
- All Forums
- :
- QlikView App Dev
- :
- Re: Re: Display data for next 4 months from the se...
- Subscribe to RSS Feed
- Mark Topic as New
- Mark Topic as Read
- Float this Topic for Current User
- Bookmark
- Subscribe
- Mute
- Printer Friendly Page
- Mark as New
- Bookmark
- Subscribe
- Mute
- Subscribe to RSS Feed
- Permalink
- Report Inappropriate Content
Display data for next 4 months from the selected month?
Could you help on how to display Project Performance data for next 4 months from the selected months when data is laid out by month in Excel for Qlikview report?
I have about 10 program managers on x axis and I have their available capacity for each month.
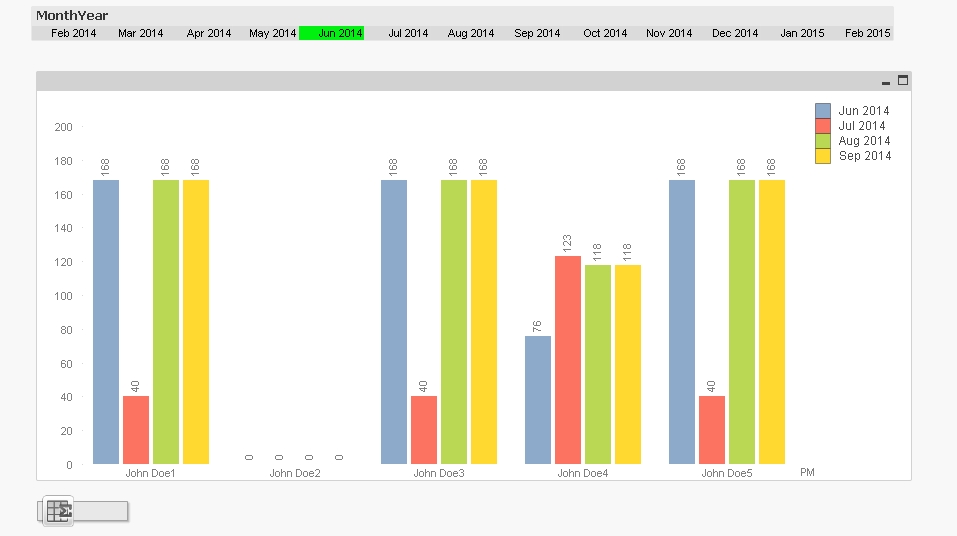
I have months selection at the top. Let's see I select Feb 2014, then I want to show data for Feb, Mar, Apr, & May for each person. Each month can have diff color bar.
Thank you
- Tags:
- qlikview_scripting
Accepted Solutions
- Mark as New
- Bookmark
- Subscribe
- Mute
- Subscribe to RSS Feed
- Permalink
- Report Inappropriate Content
- Mark as New
- Bookmark
- Subscribe
- Mute
- Subscribe to RSS Feed
- Permalink
- Report Inappropriate Content
Hi Priti,
You can modify your current expression adding the following condition in an example:
sum({$<Date={"$(='>='&max({$} Date)&'<='& Date(AddMonth(max({$}Date),4)))"}>} [Project Performance])
AddMonth returns the Date that you are specifing as first parameter, and add or substract the numbers of months in second parameter.
Good luck and tell me if you have more questions.
Regards.
- Mark as New
- Bookmark
- Subscribe
- Mute
- Subscribe to RSS Feed
- Permalink
- Report Inappropriate Content
Hi Priti,
There are many ways to achieve this by Set Analysis but most of the times it happens that when anyone suggest some result which is working on own system but will not work in your one due to difference in Date, Month format.
If you could attach your apps with sample data, it would help to achieve your requirement easily.
- Mark as New
- Bookmark
- Subscribe
- Mute
- Subscribe to RSS Feed
- Permalink
- Report Inappropriate Content
I agree, there are many possibilities, one of them attached
- Mark as New
- Bookmark
- Subscribe
- Mute
- Subscribe to RSS Feed
- Permalink
- Report Inappropriate Content
Here is my sample data. I want to have bar chart with People on x axis, and Capacity on y axis. But there should be 4 bars each with diff color for next 4 months from the month selected. I'm still not able to get to that. Please help.
| PM | Feb 14 | Mar 14 | Apr 14 | May 14 | Jun 14 | Jul 14 | Aug 14 | Sep 14 | Oct 14 | Nov 14 | Dec 14 | Jan 15 | Feb 15 |
| John Doe1 | 23 | 35 | 123.2 | 117.6 | 168 | 40 | 168 | 168 | 40 | 140 | 40 | 160 | 152 |
| John Doe2 | 0 | 0 | 0 | 0 | 0 | 0 | 0 | 0 | 0 | 0 | 0 | 160 | 152 |
| John Doe3 | 72 | 168 | 40 | 168 | 168 | 40 | 168 | 168 | 40 | 140 | 40 | 160 | 152 |
| John Doe4 | 0 | 0 | -52.8 | 75.6 | 75.6 | 123.2 | 117.6 | 117.6 | 123.2 | 100.8 | 123.2 | 112 | 106.4 |
| John Doe5 | 38 | 75.6 | 105.6 | 151.2 | 168 | 40 | 168 | 168 | 40 | 140 | 40 | 160 | 152 |
- Mark as New
- Bookmark
- Subscribe
- Mute
- Subscribe to RSS Feed
- Permalink
- Report Inappropriate Content
Thank you . Your formula worked to an extent because it gives me the capacity values only for the month selected. Not next 4 months.
- Mark as New
- Bookmark
- Subscribe
- Mute
- Subscribe to RSS Feed
- Permalink
- Report Inappropriate Content
Please see in this post to my sample data.
- Mark as New
- Bookmark
- Subscribe
- Mute
- Subscribe to RSS Feed
- Permalink
- Report Inappropriate Content
Hi,
You could try using my sample application
try to build your Requirement base on it
Hope this helps
- Mark as New
- Bookmark
- Subscribe
- Mute
- Subscribe to RSS Feed
- Permalink
- Report Inappropriate Content
- Mark as New
- Bookmark
- Subscribe
- Mute
- Subscribe to RSS Feed
- Permalink
- Report Inappropriate Content
This was perfect, thank you! All my five stars go to you! Others also helped. Thank you all. It is working for me now. !!!!!!!!!!!