Unlock a world of possibilities! Login now and discover the exclusive benefits awaiting you.
- Qlik Community
- :
- All Forums
- :
- QlikView App Dev
- :
- Re: Dont use/show possible values
- Subscribe to RSS Feed
- Mark Topic as New
- Mark Topic as Read
- Float this Topic for Current User
- Bookmark
- Subscribe
- Mute
- Printer Friendly Page
- Mark as New
- Bookmark
- Subscribe
- Mute
- Subscribe to RSS Feed
- Permalink
- Report Inappropriate Content
Dont use/show possible values
Dear Community,
as we know QlikView shows us all data that is possible, but what about when users want only to see what they active click?
For example we have a list with Months and Sales
As usual if nothing is selected the user sees all months and sales.
What if we want to change the behaviour, that if nothing is seleced nothing is shown and only if for example a month is selected the coresspondending sales are showing up. In other words if you want to see data you have to click to enable it.
Is this possible? I have not found any configuration that allows to change this behaviour.
Best regards!
- Mark as New
- Bookmark
- Subscribe
- Mute
- Subscribe to RSS Feed
- Permalink
- Report Inappropriate Content
I know you can restrict the charts to only display something when you select something with may be this kind of thing
Len(Trim(GetFieldSelections())) > 0
But may be there is another way to doing it, instead of going into each chart to do this.
- Mark as New
- Bookmark
- Subscribe
- Mute
- Subscribe to RSS Feed
- Permalink
- Report Inappropriate Content
Hi BioB,
check out the option of using Calculation Conditions in the chart in question on the Properties > General TAB:
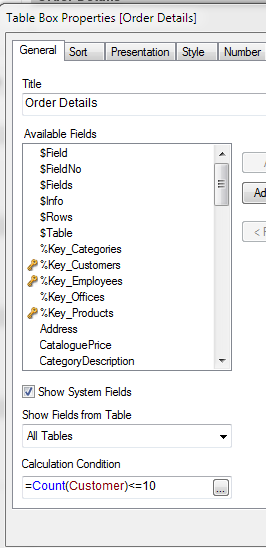
In the above example the chart only calculates if the users selects less that 10 Customers
HTH
Andy
- Mark as New
- Bookmark
- Subscribe
- Mute
- Subscribe to RSS Feed
- Permalink
- Report Inappropriate Content
What you can do in a pivot or straight table is something like this on the first Dimension's expression, which I assume would be your 'Month'...
= IF ( GetSelectedCount ( Month ) > 0, Month )
If there are any selections against Month then it'll return the Month, if not, it'll return NULL.
Now, also on the Dimensions Dialog, select that column and make sure that 'Suppress When Value Is Null' is checked.
This will prevent any rows being displayed unless there is a specific selection against the Month.