Unlock a world of possibilities! Login now and discover the exclusive benefits awaiting you.
- Qlik Community
- :
- All Forums
- :
- QlikView App Dev
- :
- Dynamic Reference Target line Qlik Desktop
Options
- Subscribe to RSS Feed
- Mark Topic as New
- Mark Topic as Read
- Float this Topic for Current User
- Bookmark
- Subscribe
- Mute
- Printer Friendly Page
Turn on suggestions
Auto-suggest helps you quickly narrow down your search results by suggesting possible matches as you type.
Showing results for
Not applicable
2016-08-19
10:09 AM
- Mark as New
- Bookmark
- Subscribe
- Mute
- Subscribe to RSS Feed
- Permalink
- Report Inappropriate Content
Dynamic Reference Target line Qlik Desktop
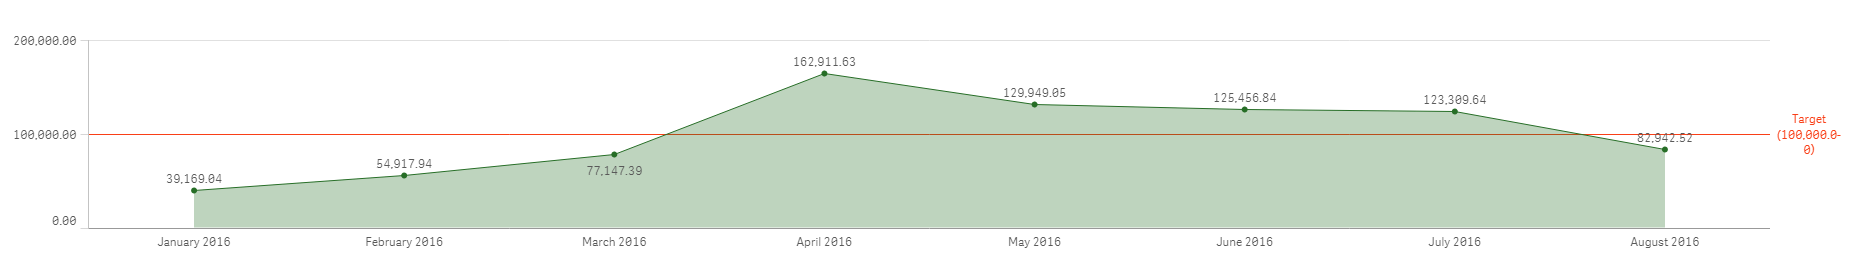
Hello everyone,
I have a target line of 100,000 (volume) using a line graph on Qlik Sense Desktop
I am wondering if there is a way of having a target line per quarter that consists of the average of the volume.
For example,
taking the average volume from January to March and having their own target line and same goes with April - June
Would really appreciate if anyone can help,
Thanks
369 Views
1 Reply
Anonymous
Not applicable
2016-08-23
05:56 AM
Author
- Mark as New
- Bookmark
- Subscribe
- Mute
- Subscribe to RSS Feed
- Permalink
- Report Inappropriate Content
I think I could calculate the average in the script, then you can add a line in your chart...
Month Quarter Average
Jan Q1 XX
Feb Q1 XX
Mar Q1 XX
Apr Q2 YY
May Q2 YY
Jun Q2 YY
255 Views