Unlock a world of possibilities! Login now and discover the exclusive benefits awaiting you.
- Qlik Community
- :
- All Forums
- :
- QlikView App Dev
- :
- Re: Re: Excell and Expressions
- Subscribe to RSS Feed
- Mark Topic as New
- Mark Topic as Read
- Float this Topic for Current User
- Bookmark
- Subscribe
- Mute
- Printer Friendly Page
- Mark as New
- Bookmark
- Subscribe
- Mute
- Subscribe to RSS Feed
- Permalink
- Report Inappropriate Content
Excell and Expressions
Hi guys,
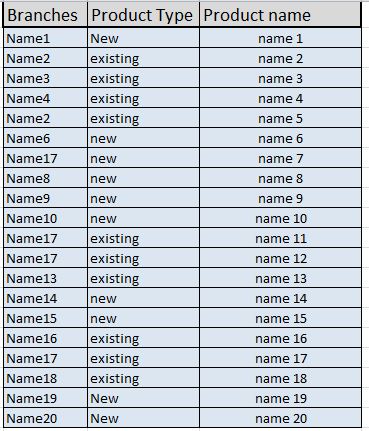
I am relatively new to Qlickview and I have some difficulties with the scritping and barchart bits. I have uploaded and excel file containing some tables and fields containing data.One of these tables is called Branches and another one is called Products. The Product table contains two values. "Existing" and "New". Those values are mapped with arround 20 branches from the Branches table.
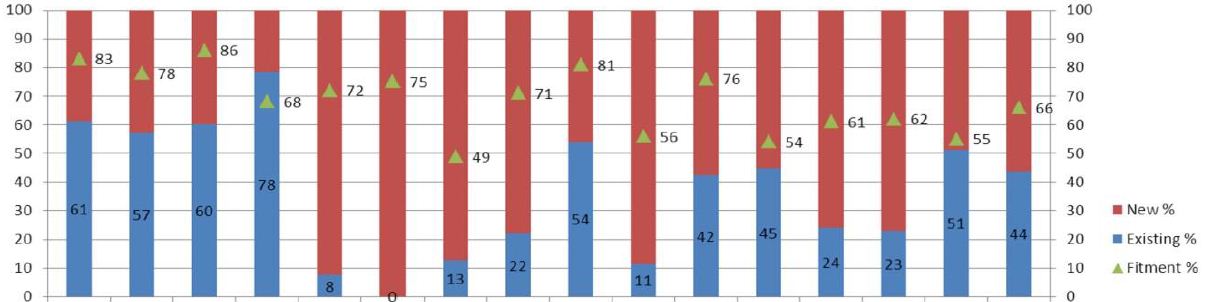
Now I am trying to make a Stacked Bar chart in Qlickview where Branches table will be the dimension of the chart and the Products the Expression. What i am trying to show is the persentage of the existing and new products within each branch and the difference between those those two. I understand that i need to compare values "new" and "existing" but both values are in one table and i can't really split them in excel, therefore I need to make a conditional Expression that picks the values individually and stackes them in one bar or make two expressions. One containing the New product info and the other one containing the Existing product info.I have attacghed an image as an example from Excel.
Could someone guide me step by step of how to do that?
Thanks in advance
- « Previous Replies
-
- 1
- 2
- Next Replies »
Accepted Solutions
- Mark as New
- Bookmark
- Subscribe
- Mute
- Subscribe to RSS Feed
- Permalink
- Report Inappropriate Content
OK, I think I know the solution:
The problem is that I missed a "}" from the end of the Set Analysis
So the ending should be "= > } Branches )" instead of "=> Branches )"
- Mark as New
- Bookmark
- Subscribe
- Mute
- Subscribe to RSS Feed
- Permalink
- Report Inappropriate Content
Please provide the sample data
- Mark as New
- Bookmark
- Subscribe
- Mute
- Subscribe to RSS Feed
- Permalink
- Report Inappropriate Content
I am unable to the any attachments on the post
- Mark as New
- Bookmark
- Subscribe
- Mute
- Subscribe to RSS Feed
- Permalink
- Report Inappropriate Content
Create a chart of stacked bar.
Create a static maximum on axis of 100
Create a static step on axis of 10
Create Expression for Old of :
100*sum(Old) / (Sum(Old) + sum(New))
Create Expression for New of:
100*sum(New) / (Sum(Old) + sum(New))
but I am not sure of "Fitment"
Hope this helps
- Mark as New
- Bookmark
- Subscribe
- Mute
- Subscribe to RSS Feed
- Permalink
- Report Inappropriate Content
Hi,
Thanks for the response!!! All i wanna do is to use the Branches as Ddimension and the Product type as Expression in a stacked bar chart as shown in the previous picture. I want it to show the percentage of the new and the existing products in every branch. (As you see the branches can appear more than once which means that a branch can be associated with more than 1 products). My probelm is that when adding the Expression, i don't know how to reference to the data withn the Product type table because there are two different values Ideally it would sound like "take all the New and Existing fileds associate with the branches and for each branch on the X-axis show me the number of products in percentage. i.e. Branch 17 has 75% of existing products and 25% New products since there are 3 existing and 1 new associated with this branch.. as shown in the picture
- Mark as New
- Bookmark
- Subscribe
- Mute
- Subscribe to RSS Feed
- Permalink
- Report Inappropriate Content
use for your "New" Expression:
(100 * Count({$<Product_Type = [New]>} Branches)) / Count({$<Product_Type = > Branches)
Replace New for Existing for your Existing Expression.
- Mark as New
- Bookmark
- Subscribe
- Mute
- Subscribe to RSS Feed
- Permalink
- Report Inappropriate Content
shouldn't the Product_Type be in []? like [Product_Type]=[New]?????
But again once I do that it does not recognize what New is.... shouldn't the new be like "New"????
Thanks
- Mark as New
- Bookmark
- Subscribe
- Mute
- Subscribe to RSS Feed
- Permalink
- Report Inappropriate Content
Have a look under Set Analysis in the help files and you will see the syntax. It is very easy to follow.
- Mark as New
- Bookmark
- Subscribe
- Mute
- Subscribe to RSS Feed
- Permalink
- Report Inappropriate Content
Hi,
I did go through the help but nothing...
This is what I get!!! I have tried a few combinations but still nothing's working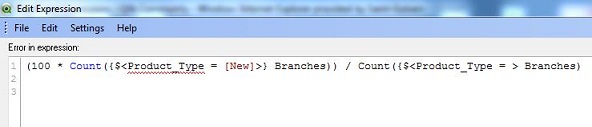
Thanks.
- Mark as New
- Bookmark
- Subscribe
- Mute
- Subscribe to RSS Feed
- Permalink
- Report Inappropriate Content
Replace [New] with {"New"} and Product_Type with [Product Type]
- « Previous Replies
-
- 1
- 2
- Next Replies »