Unlock a world of possibilities! Login now and discover the exclusive benefits awaiting you.
- Qlik Community
- :
- All Forums
- :
- QlikView App Dev
- :
- Filter Help at script side
- Subscribe to RSS Feed
- Mark Topic as New
- Mark Topic as Read
- Float this Topic for Current User
- Bookmark
- Subscribe
- Mute
- Printer Friendly Page
- Mark as New
- Bookmark
- Subscribe
- Mute
- Subscribe to RSS Feed
- Permalink
- Report Inappropriate Content
Filter Help at script side
Hi Folks ,
Below is my scenario,
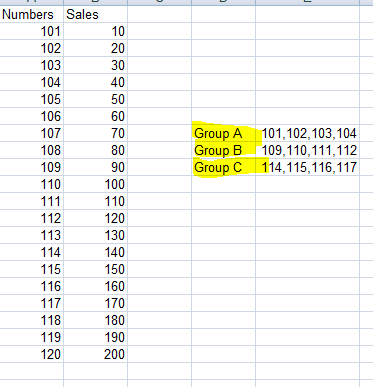
From this what I want to create a bar chart with 3 Dimension as Group A(Numbers=101,102,103,104) , Group B (Numbers=109,110,111,112), Group C(Numbers=114,115,116,117) and expression =sum(Sales)
Kindly help here!
Thanks,
AS
- Tags:
- qlikview_scripting
Accepted Solutions
- Mark as New
- Bookmark
- Subscribe
- Mute
- Subscribe to RSS Feed
- Permalink
- Report Inappropriate Content
You can achieve this from both Frond end and back end script. I will suggest to create a Field in back end and use that field as dimension
From Frond end,
Dimension:
ValueList('Group A','Group B','Group C')
Expression:
=pick(match(ValueList('Group A','Group B','Group C'),'Group A','Group B','Group C'),
Sum({<Numbers={'101','102','103','104'}>}Sales),
Sum({<Numbers={'109','110','111','112'}>}Sales),
Sum({<Numbers={'114','115','116','117'}>}Sales))
From back end script create a field Group
if(match(Numbers,'101','102','103','104'),'Group A',
if(match(Numbers,'109','110','111','112'),'Group B',
if(match(Numbers,'114','115','116','117'),'Group C'))) as Group
Create a chart
Dimension:
Group
Expression:
Sum(Sales)
- Mark as New
- Bookmark
- Subscribe
- Mute
- Subscribe to RSS Feed
- Permalink
- Report Inappropriate Content
I would recommend a solution in script
Build an Inline table
MapGroup
Load * Inline [
Numbers, Group
101, Group A
102, Group A
103, Group A
104, Group A
109, Group B
..
..
]
And use Dimension Group in your chart
You may map this table to your fact table
Advantage while doing in script: easier creation of Chart and no additional calculation
(if handling should always be the last choice).