Unlock a world of possibilities! Login now and discover the exclusive benefits awaiting you.
- Qlik Community
- :
- All Forums
- :
- QlikView App Dev
- :
- Re: Forecast Calculation
- Subscribe to RSS Feed
- Mark Topic as New
- Mark Topic as Read
- Float this Topic for Current User
- Bookmark
- Subscribe
- Mute
- Printer Friendly Page
- Mark as New
- Bookmark
- Subscribe
- Mute
- Subscribe to RSS Feed
- Permalink
- Report Inappropriate Content
Forecast Calculation
Hello,
Is there a standard procedure for calculating a forecast of sales by extrapolation (accrued revenues diviert by expired months, then multiplied by months left till yearend )
for example: sales till this month November is 2 millions, so every month = 200.000, Extrapolation ist then
November : 2,2 millions
December : 2,4 millions
If there is a Standard procedure, can I build it in the loadstatement of my Measure Sales????
- Tags:
- qlikview_scripting
- « Previous Replies
-
- 1
- 2
- Next Replies »
- Mark as New
- Bookmark
- Subscribe
- Mute
- Subscribe to RSS Feed
- Permalink
- Report Inappropriate Content
can you post some different examples and your expected result (best as file)?
thanks
regards
Marco
- Mark as New
- Bookmark
- Subscribe
- Mute
- Subscribe to RSS Feed
- Permalink
- Report Inappropriate Content
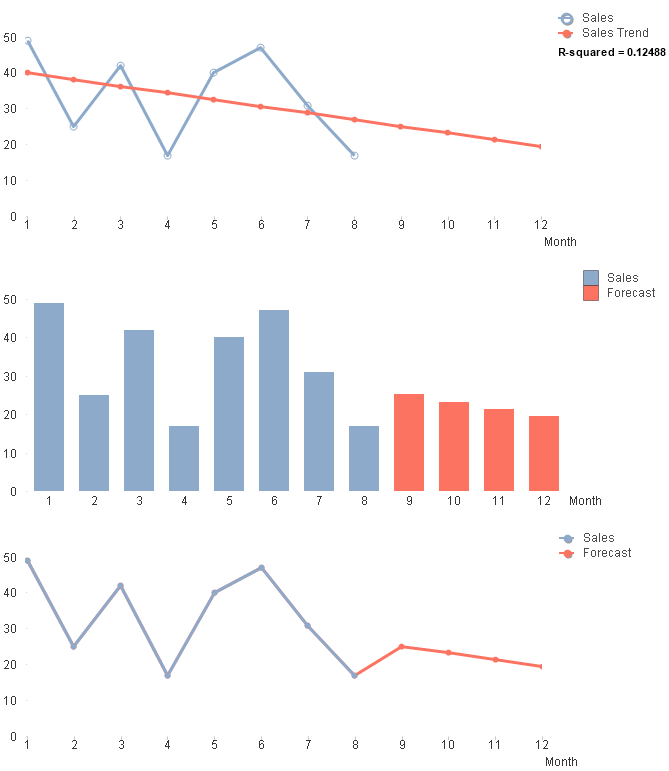
The attached example has several ways of showing a forecast. These just use chart expressions. If you really need to calculate it in script instead, I could probably figure it out.
- Mark as New
- Bookmark
- Subscribe
- Mute
- Subscribe to RSS Feed
- Permalink
- Report Inappropriate Content
Though in your case, it might be something simple like sum(Sales)*count(distinct Month)/12 or something like that. All depends on your data and what you really want to do, I think.
- Mark as New
- Bookmark
- Subscribe
- Mute
- Subscribe to RSS Feed
- Permalink
- Report Inappropriate Content
Hello John, thank you for your answer and Input .
I build it in in my InvoiceSalesmodel. then I discussed it with my Manager and some Users.
As always they came with new ideas:
The Forcast should predict next 6 months in advance,
Input amouts should be the last twelve months, for instance we are now in November so the Input should be from Last year November untill now and the Forecast should go from now (November 2016 ) till May next year.
I told them that I wished they figured that out earler. I hope you have some ideas?
Thanks in advance
- Mark as New
- Bookmark
- Subscribe
- Mute
- Subscribe to RSS Feed
- Permalink
- Report Inappropriate Content
It's been my experience that I rarely get the real requirements until I've already put a QlikView application in front of them. Until they can start interacting with the data, they either don't know or aren't willing to take the time to figure out what they really need in terms of charts and the like. Some of this is my fault, as it was that way for so long that I now by habit just get the most basic of "we want this data" requirements, and then slam out a very basic QlikView with how I might personally want to interact with that data, then solicit feedback. I usually get at least the data model right the first time (I'm usually very familiar with the data), and it's mostly a matter of building additional charts and ways of interacting with the data from there.
Anyway, that's all an aside. See the attached for a data model solution to your problem, since it seemed that was your preference. I'm sure it could be solved in the chart too if preferred. Here's the script of interest:
CONCATENATE (Data)
LOAD
monthstart(today(),iterno()-1) as Month
,monthstart(today(),iterno()-1)*Slope+Intercept as Sales
,'Forecast' as Type
WHILE iterno() <= 6
;
LOAD
linest_m(Sales,Month) as Slope
,linest_b(Sales,Month) as Intercept
;
LOAD
Month
,sum(Sales) as Sales
RESIDENT Data
WHERE Month >= monthstart(today(),-12)
GROUP BY Month
;
We're doing a linear regression over the past 12 months of data to predict the future six months of data. We also have types of Actual vs. Forecast, and these are associated with colors loaded in the script and used in the background color expression.
The linear trendline in the chart is only to show you that it works, and is based only on the previous 12 months. The trendline doesn't match the forecast when all months are shown, but does match when only the past 12 months and the forecast 6 months are shown.
- Mark as New
- Bookmark
- Subscribe
- Mute
- Subscribe to RSS Feed
- Permalink
- Report Inappropriate Content
Hello John,
Thanks for your support.
Your solution works, had to change some minor Details (like some fieldnames).
I hope my Manager likes what he get to see on Monday
Have a nice weekend
Court
- Mark as New
- Bookmark
- Subscribe
- Mute
- Subscribe to RSS Feed
- Permalink
- Report Inappropriate Content
Hi John,
Need Your help.
your solution is perfectly working for Organisation forecasting for future months.
But i have some more specific requirement
Let i have Monthwise, Branchwise,Product wise granular data of last 24 months in the following format :
Branch Product Month SaleAmount
A P01 Jan2016 1000
A P02 Jan2016 500
A P03 Jan2016 800
B P01 Jan2016 1000
B P02 Jan2016 500
B P03 Jan2016 800
And i have to forecast "Product wise","Branch wise", "SaleAmount" for futuremonths, i.e. say for month Feb,2017 and March'2017.
Can you please help...
bj
- Mark as New
- Bookmark
- Subscribe
- Mute
- Subscribe to RSS Feed
- Permalink
- Report Inappropriate Content
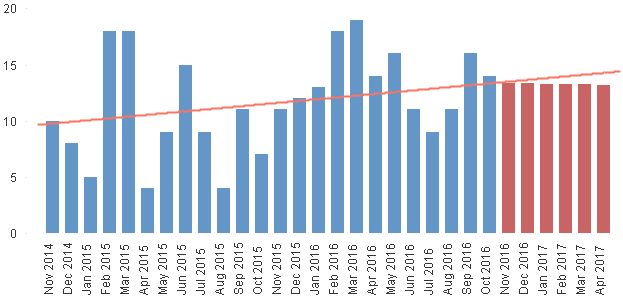
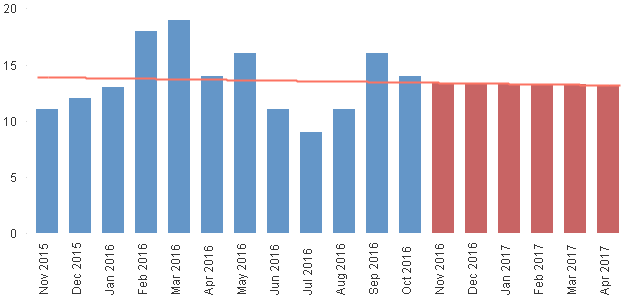
Just add the dimensions you want to forecast by to the loads where you concatenate the forecast. See attached and script below. Well, this is forecasting 6 months from the past 12, but replace 6 and 12 with whatever you want in this script, and I'd think it would work like you want.
CONCATENATE (Data)
LOAD
Branch
,Product
,monthstart(today(),iterno()-1) as Month
,monthstart(today(),iterno()-1)*Slope+Intercept as Sales
,'Forecast' as Type
WHILE iterno() <= 6
;
LOAD
Branch
,Product
,linest_m(Sales,Month) as Slope
,linest_b(Sales,Month) as Intercept
GROUP BY
Branch
,Product
;
LOAD
Branch
,Product
,Month
,sum(Sales) as Sales
RESIDENT Data
WHERE Month >= monthstart(today(),-12)
GROUP BY
Branch
,Product
,Month
;
- Mark as New
- Bookmark
- Subscribe
- Mute
- Subscribe to RSS Feed
- Permalink
- Report Inappropriate Content
Hii John,,
Thanks for your support.Linear Trend works perfectly with my data
Can you please guide to develop the seasonal trend on the basis of the above generated Linear Trend.
i.e. for example, seasonal trend of Feb'2017 will be
Linear Trend of Feb'2017 + (Actual of Feb'2016 - Linear Trend of Feb'2016)
and this is require to generate at Branch,Product level.
Thanks in advance..
- « Previous Replies
-
- 1
- 2
- Next Replies »