Unlock a world of possibilities! Login now and discover the exclusive benefits awaiting you.
- Qlik Community
- :
- All Forums
- :
- QlikView App Dev
- :
- Re: Grouping Dimensions in a Table
- Subscribe to RSS Feed
- Mark Topic as New
- Mark Topic as Read
- Float this Topic for Current User
- Bookmark
- Subscribe
- Mute
- Printer Friendly Page
- Mark as New
- Bookmark
- Subscribe
- Mute
- Subscribe to RSS Feed
- Permalink
- Report Inappropriate Content
Grouping Dimensions in a Table
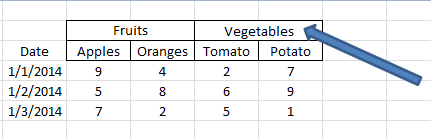
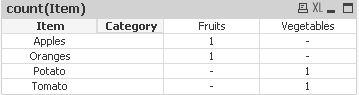
Hello my QlikView friends  I am hoping this is very easy to understand and create. I have an example table pictured below. I want to know how to create the grouped dimension section, with the arrow pointing to it. It is my current understanding that I would have Expressions for Apples and Oranges, summing each. But how do I group those two fields under another calculated dimension? Thank you
- Tags:
- qlikview_scripting
- Mark as New
- Bookmark
- Subscribe
- Mute
- Subscribe to RSS Feed
- Permalink
- Report Inappropriate Content
Create a table, like
Load * inline [
Category, Item
Fruits, Apples
Fruits, Oranges
Vegetables, Tomato
Vegetables, Potato
];
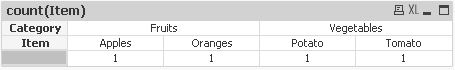
No, you can use the Category as a dimension and pivot it to columns
Eduardo
- Mark as New
- Bookmark
- Subscribe
- Mute
- Subscribe to RSS Feed
- Permalink
- Report Inappropriate Content
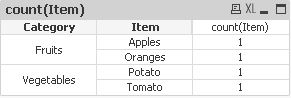
I forgot something: you can also pivot the Item Dimension to a column, under category, and have what you want.
Eduardo
- Mark as New
- Bookmark
- Subscribe
- Mute
- Subscribe to RSS Feed
- Permalink
- Report Inappropriate Content
Simple add one calculated dimension
=If(Match(FruitType,'Apples','Oranges'),'Fruit',
if(Match(FruitType,'Tomoto','Potato'),'Vegetables'))
Note:- I assume FruitType contains(Apples,Oranges,Tomoto,Potato)
- Mark as New
- Bookmark
- Subscribe
- Mute
- Subscribe to RSS Feed
- Permalink
- Report Inappropriate Content
In a PivotTable upload your data.
Click Category, and then drag until the blue arrow on the column expression
will look like
Click on item and drag down Category until the blue arrow as shown below
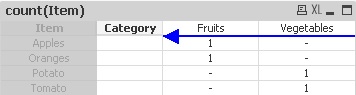
will look like