Unlock a world of possibilities! Login now and discover the exclusive benefits awaiting you.
- Qlik Community
- :
- All Forums
- :
- QlikView App Dev
- :
- Re: How to modify long set expression and need 2 E...
- Subscribe to RSS Feed
- Mark Topic as New
- Mark Topic as Read
- Float this Topic for Current User
- Bookmark
- Subscribe
- Mute
- Printer Friendly Page
- Mark as New
- Bookmark
- Subscribe
- Mute
- Subscribe to RSS Feed
- Permalink
- Report Inappropriate Content
How to modify long set expression and need 2 Expression for plot 2 line chart into 1 shot expression ?
Hi All
Chart 1 i thing is good. because only 1 expression & expression is very shot , it can plot 2 line.
Sum(
{<Year={'>$(=year(today())-2)'}>}
$(ColumnDim51)/$(Columndim89)/1000)
$(ColumnDim51) allow me to slect display sales , gross profit.
Chart 2 is not so powerful , it require very long expression and 2 expression compare to chart 1.
Money(RangeSum(Above(TOTAL Sum(DISTINCT{<year = {"$(=Max(year)-1)"},$(ColumnDim51) ={$(ColumnDim51)}>} Amount*1/ $(Columndim89)/1000), 0, RowNo(TOTAL))), $(vMoneyFormatK))
Money(RangeSum(Above(TOTAL Sum(DISTINCT{<year = {"$(=Max(year)-0)"},$(ColumnDim51) ={$(ColumnDim51)}>} Amount*1/ $(Columndim89)/1000), 0, RowNo(TOTAL))), $(vMoneyFormatK))
{$(ColumnDim51) allow me to select display revenue or net profit.
Now my question is , how to modify the chart 2 expression and make it only 1 expression by follow chart 1 example ?
Muy next posting will enclosed my QV Doc
Paul
- Tags:
- qlikview_scripting
- Mark as New
- Bookmark
- Subscribe
- Mute
- Subscribe to RSS Feed
- Permalink
- Report Inappropriate Content
My QV Doc
- Mark as New
- Bookmark
- Subscribe
- Mute
- Subscribe to RSS Feed
- Permalink
- Report Inappropriate Content
This expression almost works, but would need you to sort your year field in the script by ascending the first time it is getting created:
Money(Only({<year = {$(=Max(year)-0), $(=Max(year)-1)},$(ColumnDim51) ={$(ColumnDim51)}>} Aggr(NODISTINCT RangeSum(Above(TOTAL Sum(DISTINCT{<year = {$(=Max(year)-0), $(=Max(year)-1)},$(ColumnDim51) ={$(ColumnDim51)}>} Amount*1/ $(Columndim89)/1000), 0, Only({<year>}month))), year, month)), $(vMoneyFormatK))
Right now it is accumulating good up untill month 11, but for some reason stops there. Not sure what is going on. But I guess somebody can make improvements
- Mark as New
- Bookmark
- Subscribe
- Mute
- Subscribe to RSS Feed
- Permalink
- Report Inappropriate Content
Actually the issue is in month sorting. If you can fix that, the above expression will be fixed. Based on load order the chart object shows this in a table box;
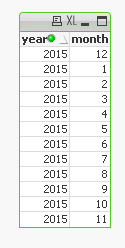
I you can fix this in the script to show 1, 2, 3, ...., 12... the above will work.
- Mark as New
- Bookmark
- Subscribe
- Mute
- Subscribe to RSS Feed
- Permalink
- Report Inappropriate Content
Hi Sunny
Appreciated very much for your help . it is okay , i will stick to 2 expression.
Paul
- Mark as New
- Bookmark
- Subscribe
- Mute
- Subscribe to RSS Feed
- Permalink
- Report Inappropriate Content
Are you sure? There is definitely a way to fix it, but as I mentioned it is script based and since I don't have the database files I won't be able to run it for you. You will have to make that change on your own 
- Mark as New
- Bookmark
- Subscribe
- Mute
- Subscribe to RSS Feed
- Permalink
- Report Inappropriate Content
Hi Sunny
I value your help. This morning i wake up , i think over again , yesterday question i post is not correct. my actual requirement is .
When user select select Column51 = $(ColumnDim51) = sales
Chart 1 is working fine with the Expression is below :-
money(
Sum(
{<Year={'>$(=year(today())-2)'}>}
$(ColumnDim51)/$(Columndim89)/1000)
, $(vMoneyFormatK))
Now when user select select Column51 = $(ColumnDim51) ={$(ColumnDim51)}>} Amount = rEVENUE
Chart 2 expression need to change , My assume expression is below :-
money(
Sum(
{<Year={'>$(=year(today())-2)'}>}
($(ColumnDim51) ={$(ColumnDim51)}>} Amount)/$(Columndim89)/1000)
, $(vMoneyFormatK))
But it display no line.
Why ?
Paul
- Mark as New
- Bookmark
- Subscribe
- Mute
- Subscribe to RSS Feed
- Permalink
- Report Inappropriate Content
I move this post to top , as now i need to work on issue now.