Unlock a world of possibilities! Login now and discover the exclusive benefits awaiting you.
- Qlik Community
- :
- All Forums
- :
- QlikView App Dev
- :
- How to remove already accumulated values from data...
- Subscribe to RSS Feed
- Mark Topic as New
- Mark Topic as Read
- Float this Topic for Current User
- Bookmark
- Subscribe
- Mute
- Printer Friendly Page
- Mark as New
- Bookmark
- Subscribe
- Mute
- Subscribe to RSS Feed
- Permalink
- Report Inappropriate Content
How to remove already accumulated values from data source?
Hi,
We have recently connected to a new data source and when extracting data we have noticed the values have been accumulated by day.
Within each day there will be multiple 'areas' which we would like to show the individual transactions by each time stamp.
The excel file attached shows a cut down version of what the extract looks like and also how we would like to show it.
Any support would be hugely appreciated!
Charlie
- Mark as New
- Bookmark
- Subscribe
- Mute
- Subscribe to RSS Feed
- Permalink
- Report Inappropriate Content
can you please explain what the original data is summing on and how you would like it to be sumed?
it looks like the only difference is the value in Sum field
- Mark as New
- Bookmark
- Subscribe
- Mute
- Subscribe to RSS Feed
- Permalink
- Report Inappropriate Content
The accumulation occurs within the data source and I will not be able to interrogate into this system further to get to the raw counts.
The Value is the only field I would like to adjust.. I would like to remove the accumulated values and replace with the individual counts by time group?
Sorry if I am not explaining well.
Charlie
- Mark as New
- Bookmark
- Subscribe
- Mute
- Subscribe to RSS Feed
- Permalink
- Report Inappropriate Content
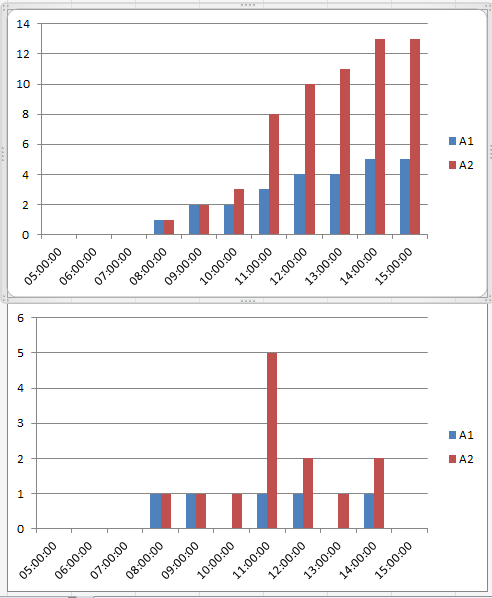
Below is an example of how the data is shown in QV, and below is how we would like to present.
Thanks
- Mark as New
- Bookmark
- Subscribe
- Mute
- Subscribe to RSS Feed
- Permalink
- Report Inappropriate Content
what do you consider to be a time group? are the groups the actual date/time combiantion and you want to know how much occured within each combination isntead of it being cumulative?
| 1/1/2015 | ####### | 01/01/2015 11:00:00 | 5 |
| 1/1/2015 | ####### | 01/01/2015 12:00:00 | 2 |
in the snippet above, do you want to accumulate to say there are 5 transaction on 1/1/2015 within the 11:00 hour and there were 2 transactions on 1/1/2015 in the 12:00 hour?
- Mark as New
- Bookmark
- Subscribe
- Mute
- Subscribe to RSS Feed
- Permalink
- Report Inappropriate Content
a:
LOAD Date,
Time,
TimeStamp,
Sum,
Area
FROM
Example.xls
(biff, embedded labels, header is 1 lines, table is Sheet1$);
b:
LOAD Date,
Time,
TimeStamp,
Sum,
Area,
if(Area=peek(Area) and Date=Peek(Date), Sum - Peek(Sum), Sum) as NewSum
Resident a
order by Area, TimeStamp;
DROP Table a;
I think the Sum (not cumulated) in row 45 of excel should be 2
- Mark as New
- Bookmark
- Subscribe
- Mute
- Subscribe to RSS Feed
- Permalink
- Report Inappropriate Content
you should be able to use the time and area as a dimension and count the number of transactions