Unlock a world of possibilities! Login now and discover the exclusive benefits awaiting you.
- Qlik Community
- :
- All Forums
- :
- QlikView App Dev
- :
- Re: How to use calculaed dimension or bring TOP 10...
- Subscribe to RSS Feed
- Mark Topic as New
- Mark Topic as Read
- Float this Topic for Current User
- Bookmark
- Subscribe
- Mute
- Printer Friendly Page
- Mark as New
- Bookmark
- Subscribe
- Mute
- Subscribe to RSS Feed
- Permalink
- Report Inappropriate Content
How to use calculaed dimension or bring TOP 10 dimension limit in PIVOT Table
Hi Friends, We have the dimension limit in Charts but I dont see an option to limit dimension (TOP 10) in PIVOT Table object.
I have 2 columns as below.
1. IT Team
2. Ticket #
I am having a PIVOT Table which will show us IT Team and Count of Tickets as below.
IT Team A = 200
IT Team B = 300
and so on...
But the PIVOT Table shows the complete list. is there a way to create the PIVOT table to show only TOP 10 IT teams based on count of tickets handled?
- Mark as New
- Bookmark
- Subscribe
- Mute
- Subscribe to RSS Feed
- Permalink
- Report Inappropriate Content
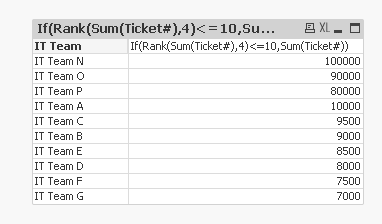
you can use Rank function to show the top n values,
If(Rank(Count(Ticket)<=10,Rank(Count(Ticket))
- Mark as New
- Bookmark
- Subscribe
- Mute
- Subscribe to RSS Feed
- Permalink
- Report Inappropriate Content
create expression
=Count({<[IT Team] ={"=rank(count(Ticket),4)<=10"}>}Ticket)
- Mark as New
- Bookmark
- Subscribe
- Mute
- Subscribe to RSS Feed
- Permalink
- Report Inappropriate Content
Vijay,
use below calculated dimension
=if(aggr(rank(count(Ticket #)),IT Team)<=10,IT Team)
it will first calculate the count of Tickets,
then aggregate it based on IT team,
then compare it with 10 (top 10)
then display the IT Team as dimension.
- Mark as New
- Bookmark
- Subscribe
- Mute
- Subscribe to RSS Feed
- Permalink
- Report Inappropriate Content
See attached -