Unlock a world of possibilities! Login now and discover the exclusive benefits awaiting you.
- Qlik Community
- :
- All Forums
- :
- QlikView App Dev
- :
- Re: Intersection of two datasets in Set Analysis
- Subscribe to RSS Feed
- Mark Topic as New
- Mark Topic as Read
- Float this Topic for Current User
- Bookmark
- Subscribe
- Mute
- Printer Friendly Page
- Mark as New
- Bookmark
- Subscribe
- Mute
- Subscribe to RSS Feed
- Permalink
- Report Inappropriate Content
Intersection of two datasets in Set Analysis
Hi guys,
I have the following scenario:
- Key account managers who visit their clients (accounts) during a period of time);
- The Key account managers can visit their accounts according to their panels as well as accounts that don't belong to their panels;
- An Account panel table that contains each account that belongs to each Key account manager (Island Table).
CHALLENGE:
- I need to calculate a panel coverage that shows the ratio between the accounts that a manager visited (only accounts that belong to its panel) and the manager's panel (Island table).
EXAMPLE:
VISIT TABLE: The manager ID 10 has visited the four accounts listed below.
| Manager ID | Account ID |
|---|---|
| 10 | 1001 |
| 10 | 1002 |
| 10 | 1003 |
| 10 | 1005 |
ACCOUNT PANEL TABLE (Island Table): The manager ID 10 has 4 accounts in his panel according to the table below:
| Manager ID | Account ID |
|---|---|
| 10 | 1001 |
| 10 | 1002 |
| 10 | 2001 |
| 10 | 2002 |
FORMULA RULE:
- Looking at both VISIT and ACCOUNT tables, it's possible to see that the manager 10 visited only two accounts that belong to his panel (1001 and 1002). However, he has four accounts in his panel. Having said that, the formula should be:
Panel Coverage = 2/4 = 50%.
It means that, even though the manager 10 visited four accounts, only two accounts belong to his panel, so he is covering only 50% of his panel.
My question is: Is that possible to do an intersection in set analysis to get this panel? In this ratio, I want that the numerator consider only the accounts that belong to the manager's panel (in this case 2) divided by the number of accounts that the manager has in his personal panel.
Thank you in advance.
Best,
Rubens Rodrigues
Accepted Solutions
- Mark as New
- Bookmark
- Subscribe
- Mute
- Subscribe to RSS Feed
- Permalink
- Report Inappropriate Content
Try this?
Visit:
LOAD * INLINE [
ManagerID, AccountID
10, 1001
10, 1002
10, 1003
10, 1005
];
Panel:
LOAD * INLINE [
ManagerID, PanelAccountID
10, 1001
10, 1002
10, 2001
10, 2002
];
Using Straight table add
Dim: ManagerID
Expr: = Count({< AccountID = P(AccountID)> * <AccountID = P(PanelAccountID)> } AccountID)/Count(TOTAL AccountID)
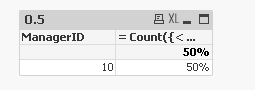
Change the Number Settings in Number tab of Chart Properties. Or use Num() function for formatting.
- Mark as New
- Bookmark
- Subscribe
- Mute
- Subscribe to RSS Feed
- Permalink
- Report Inappropriate Content
Read here this might help:
- Mark as New
- Bookmark
- Subscribe
- Mute
- Subscribe to RSS Feed
- Permalink
- Report Inappropriate Content
Try this?
Visit:
LOAD * INLINE [
ManagerID, AccountID
10, 1001
10, 1002
10, 1003
10, 1005
];
Panel:
LOAD * INLINE [
ManagerID, PanelAccountID
10, 1001
10, 1002
10, 2001
10, 2002
];
Using Straight table add
Dim: ManagerID
Expr: = Count({< AccountID = P(AccountID)> * <AccountID = P(PanelAccountID)> } AccountID)/Count(TOTAL AccountID)
Change the Number Settings in Number tab of Chart Properties. Or use Num() function for formatting.
- Mark as New
- Bookmark
- Subscribe
- Mute
- Subscribe to RSS Feed
- Permalink
- Report Inappropriate Content
Thanks!