Unlock a world of possibilities! Login now and discover the exclusive benefits awaiting you.
- Qlik Community
- :
- All Forums
- :
- QlikView App Dev
- :
- Re: Last 12 months expression help!
- Subscribe to RSS Feed
- Mark Topic as New
- Mark Topic as Read
- Float this Topic for Current User
- Bookmark
- Subscribe
- Mute
- Printer Friendly Page
- Mark as New
- Bookmark
- Subscribe
- Mute
- Subscribe to RSS Feed
- Permalink
- Report Inappropriate Content
Last 12 months expression help!
Hi Folks,
We are having one of our application in which
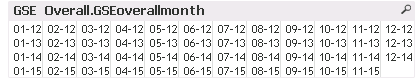
Dimension: = Month ([GSE Overall.GSEoverallmonth]) & '-' & Year ([GSE Overall.GSEoverallmonth])
Expression: [GSE Overall.ppm]
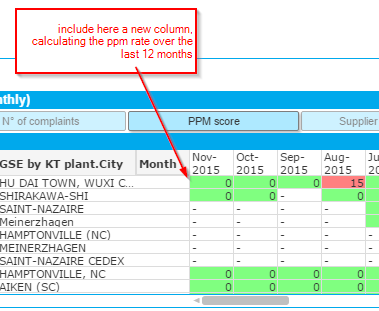
Below is the result table , now here we want one column to show last 12 months ppm rate.
Please suggest how to do it.
Actually we are not using any calendar for this Dashboard, otherwise I could have done something similar:
Sum({<YearMonth ={">=$(=Date(addmonths(Max(YearMonth), -12), 'MMM-YY')) <=$(=Date(addmonths(Max(YearMonth), -1), 'MMM-YY'))"} >} Sales)
Thanks,
AS
- Tags:
- qlikview_scripting
- Mark as New
- Bookmark
- Subscribe
- Mute
- Subscribe to RSS Feed
- Permalink
- Report Inappropriate Content
what is the values in GSE Overall.GSEoverallmonth Field
- Mark as New
- Bookmark
- Subscribe
- Mute
- Subscribe to RSS Feed
- Permalink
- Report Inappropriate Content
Hi amit,
As you mentioned you have dimension information in month-year format. Don't you have field containing date entries against each row in the table, if its the case then expression you wrote should be working fine.
Now question is , in table you have included monthly column using calculations then How you managed to calculate them using expression?
- Mark as New
- Bookmark
- Subscribe
- Mute
- Subscribe to RSS Feed
- Permalink
- Report Inappropriate Content
Thanks,
AS
- Mark as New
- Bookmark
- Subscribe
- Mute
- Subscribe to RSS Feed
- Permalink
- Report Inappropriate Content
Hi Amit,
Try this Expression :
sum({<Date = {">=$(=MonthStart(Max(Date), -12))<=$(=MonthEnd(Max(Date)))"},Year=,Month=>}Sales).
-Nagarjun
- Mark as New
- Bookmark
- Subscribe
- Mute
- Subscribe to RSS Feed
- Permalink
- Report Inappropriate Content
I am not sure but you can try this
=rangesum(after( sum( [GSE Overall.ppm]), 1,12 )) or rangesum(after( sum( [GSE Overall.ppm]), 0,12 ))
or
rangesum(after( only( [GSE Overall.ppm]), 1,12 )) or rangesum(after( only( [GSE Overall.ppm]), 0,12 ))
- Mark as New
- Bookmark
- Subscribe
- Mute
- Subscribe to RSS Feed
- Permalink
- Report Inappropriate Content
Any suggestions???
PFA of sample qvw
Thanks,
AS
- Mark as New
- Bookmark
- Subscribe
- Mute
- Subscribe to RSS Feed
- Permalink
- Report Inappropriate Content
See the attached