Unlock a world of possibilities! Login now and discover the exclusive benefits awaiting you.
- Qlik Community
- :
- All Forums
- :
- QlikView App Dev
- :
- Re: Last selected value minus first selected value
- Subscribe to RSS Feed
- Mark Topic as New
- Mark Topic as Read
- Float this Topic for Current User
- Bookmark
- Subscribe
- Mute
- Printer Friendly Page
- Mark as New
- Bookmark
- Subscribe
- Mute
- Subscribe to RSS Feed
- Permalink
- Report Inappropriate Content
Last selected value minus first selected value
Hello,
I have the following expression:
Aggr (Sum (TL1),[day/month/year],P1)
Where TL1 is current quantity of liquid (which input on daily basic) and P1 is the type of the liquid.
I want to show, for every selected period ,which the user can make for this chart, what is the difference between the last selected value from the first value
Surly if I knew how to calculate the last and first value it will do.
For example if I select from 23 to April to 17 of may , and every day hold a value I which to know what is the difference between the value of 17.5 minus 23.4 (and see how much liquid went loss).
How does is combine with the fact that I have more than one liquid ? since the user can show in the chart 4 diff. liquids or filter only one.
Thank you for your help!!!!
Nir GL
- Tags:
- qlikview_scripting
Accepted Solutions
- Mark as New
- Bookmark
- Subscribe
- Mute
- Subscribe to RSS Feed
- Permalink
- Report Inappropriate Content
Hello,
I got the answer, if any one else need it:
Sum({<Date={'$(=MIn(Date))'}>} Qty1+Qty2) - Sum({<Date={'$(=Max(Date))'}>} Qty1+Qty2)
Where Qty1+Qty2 is just an example to my complex aggregation expression.
In addition you need to define in the script the following:
date(date#(Date,'DD.MM.YY'),'DD/MM/YYYY') as Date,
I attach the Qlik and Data file which I created to explain my problem.
Good Luck and thank you all for your effort.
Nir
- Mark as New
- Bookmark
- Subscribe
- Mute
- Subscribe to RSS Feed
- Permalink
- Report Inappropriate Content
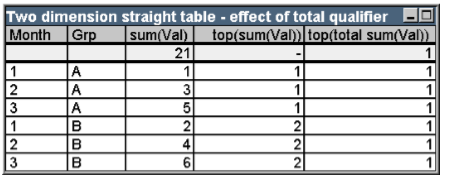
Can you post sample data and desired output, see if below details can help to calculate top value, taken from ref manual -
- Mark as New
- Bookmark
- Subscribe
- Mute
- Subscribe to RSS Feed
- Permalink
- Report Inappropriate Content
Unfortunately I am not allowed to export the data BUT
let say I have the following data for the last week:
10.9 = 100 (liters)
11.9=99
12.9=97
13.9=97
14.9=96.5
15.9=95
16.9=94
17.9=90
Now the user can select the whole week (10-17.9) than I wish to see in a Text Box (or what ever) the calculated value 10 (100-90).
The user can also select 13-16.9 than I wish to see the calculated value 3 (97-94).
This is for Tank 1 which is in Group A in country X.
I have many tanks of liquid in Group A and more than one group in Country X.
In addition i Have different liquids in the different tank (not mix in one tank of course)
Nir
- Mark as New
- Bookmark
- Subscribe
- Mute
- Subscribe to RSS Feed
- Permalink
- Report Inappropriate Content
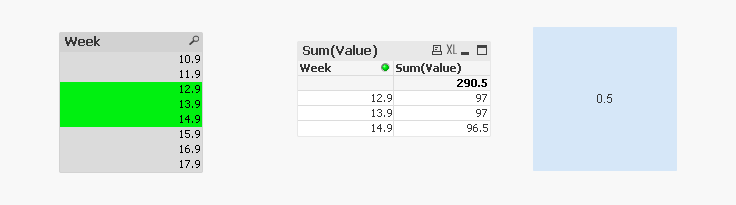
Try like attached -
=Sum({<Week={$(=min(Week))}>}Aggr(Sum(Value),Week))-Sum({<Week={$(=max(Week))}>}Aggr(Sum(Value),Week))
- Mark as New
- Bookmark
- Subscribe
- Mute
- Subscribe to RSS Feed
- Permalink
- Report Inappropriate Content
Thank you for your fast reply but maybe I should be more clear:
1.I have a line chart, displaying agg quantity of many Tanks with liquid (containers) which can be filtered by many list box like:
Type of material in container and\or country in which the Tanks located, Cites in which the tank located and set.
2. In addition, the user can filet (by list box) any period he likes: from a year\month\day list box (so he can pick 3 days or 482 days or every first of the month for 2014 and 2015 and so on. The data reflect in the line chart with the expression (as I wrote in the first post) : Aggr (Sum (TL1),[day/month/year],P1) where TL1=Liquid qty and P1=Liquid type.
3. I do not want to calculate max - min value but earliest's date value minus latest's date value.
I tried adjusting your express , looking for the earliest point with:
=Sum({<Day\Month\Year={$(=min(Day\Month\Year))}>}Aggr(Sum(TL1),Day\Month\Year)) but there is a script problem with {$(... it show the expression after the $ as a variable (in gray).
Thank you!
Nir
- Mark as New
- Bookmark
- Subscribe
- Mute
- Subscribe to RSS Feed
- Permalink
- Report Inappropriate Content
If you can share sample data (even 1-2 sample rows) with all dimensions, I think I can make it work. Day\Month\Year is what? single date value or 3 different fields? invalid date formatting can also create issue. Somehow I feel it can be applied properly to identify min selected week(period) and max selected week(period) to get rid of issues. Set Analysis syntax is bit complex, even a small typo of ,{< here and there can create problem.
- Mark as New
- Bookmark
- Subscribe
- Mute
- Subscribe to RSS Feed
- Permalink
- Report Inappropriate Content
Hello,
I got the answer, if any one else need it:
Sum({<Date={'$(=MIn(Date))'}>} Qty1+Qty2) - Sum({<Date={'$(=Max(Date))'}>} Qty1+Qty2)
Where Qty1+Qty2 is just an example to my complex aggregation expression.
In addition you need to define in the script the following:
date(date#(Date,'DD.MM.YY'),'DD/MM/YYYY') as Date,
I attach the Qlik and Data file which I created to explain my problem.
Good Luck and thank you all for your effort.
Nir