Unlock a world of possibilities! Login now and discover the exclusive benefits awaiting you.
- Qlik Community
- :
- All Forums
- :
- QlikView App Dev
- :
- Line chart question
- Subscribe to RSS Feed
- Mark Topic as New
- Mark Topic as Read
- Float this Topic for Current User
- Bookmark
- Subscribe
- Mute
- Printer Friendly Page
- Mark as New
- Bookmark
- Subscribe
- Mute
- Subscribe to RSS Feed
- Permalink
- Report Inappropriate Content
Line chart question
hello i want to create a line chart which counts the material produced every minute. I have an sql db with date and time (23.05.2017 23:30:10) for measure i will count a column. When i add the Date column from sql i see multiple dates as dimension. I need to see the number of produced products every minute. So i dont want to see date as dimension but minute.
I hope i am clear.
- Tags:
- qlikview_scripting
- « Previous Replies
-
- 1
- 2
- Next Replies »
Accepted Solutions
- Mark as New
- Bookmark
- Subscribe
- Mute
- Subscribe to RSS Feed
- Permalink
- Report Inappropriate Content
Hi Erhan, the dates are different (different second), so it will be different values, to show only only dimension value per minute you need to create the field that has the exact same value for every minute. That is, removing seconds and miliseconds:
TimeStamp(Floor(Timestamp#(DateTime, 'YYYY-MM-DD hh:mm:ss.fff'), 1/1440)) as DateTime
Check attachment.
- Mark as New
- Bookmark
- Subscribe
- Mute
- Subscribe to RSS Feed
- Permalink
- Report Inappropriate Content
May be try this:
LOAD *,
Time(Timestamp(Timestamp#(TimeLoad, 'DD.MM.YYYY hh:mm:ss'),'DD.MM.YYYY hh:mm:ss'), 'mm') AS TimeOnly
From YourDataSourceTableName;
- Mark as New
- Bookmark
- Subscribe
- Mute
- Subscribe to RSS Feed
- Permalink
- Report Inappropriate Content
Hi Erhan, the is also the Minute() function:
Minute(FieldName) as Minute
Or maybe:
Minute(Timestamp#(FieldName, 'DD.MM.YYYY hh:mm:ss')) as Minute
- Mark as New
- Bookmark
- Subscribe
- Mute
- Subscribe to RSS Feed
- Permalink
- Report Inappropriate Content
please post some sample data and your expected result.
- Mark as New
- Bookmark
- Subscribe
- Mute
- Subscribe to RSS Feed
- Permalink
- Report Inappropriate Content
thank yo i,2ll try and answer
- Mark as New
- Bookmark
- Subscribe
- Mute
- Subscribe to RSS Feed
- Permalink
- Report Inappropriate Content
Started loading data
Connecting to MaintenanceSQL Connected
The following error occurred:
No qualified path for file: ***
The error occurred here:
LOAD *, Time(Timestamp(Timestamp#(DateTime,'DD.MM.YYYY hh:mm:ss'),'DD.MM.YYYY hh:mm:ss'),'mm')AS Timeonly From [MaintenanceSQL]
Data has not been loaded. Please correct the error and try loading again.
my date coloum name in sql is DateTime, i wrote your code in a new section at data load editor.
- Mark as New
- Bookmark
- Subscribe
- Mute
- Subscribe to RSS Feed
- Permalink
- Report Inappropriate Content
hello
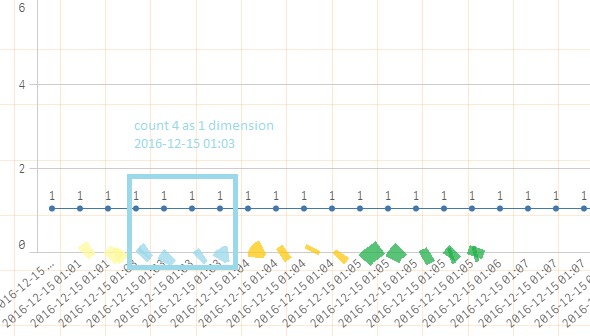
maybe i just need a measure function for this. like take the four same minute as one and count the other column
currently my measure is count (reference)
- Mark as New
- Bookmark
- Subscribe
- Mute
- Subscribe to RSS Feed
- Permalink
- Report Inappropriate Content
can you post your complete script??
Regards,
- Mark as New
- Bookmark
- Subscribe
- Mute
- Subscribe to RSS Feed
- Permalink
- Report Inappropriate Content
DateTime Reference
2016-12-15 12:27:09.000 12341234
2016-12-15 12:27:23.000 12341234
2016-12-15 12:29:09.000 32123451
2016-12-15 12:29:22.000 32123451
2016-12-15 12:29:28.000 12341234
2016-12-15 12:29:42.000 32123451
2016-12-15 12:29:52.000 32123451
2016-12-15 12:30:06.000 45134123
2016-12-15 12:31:12.000 45134123
2016-12-15 12:31:25.000 45134123
i need to see 2 at minute 12.27 at 2016-12-15 , need to see 5 at minute 12:29 at 2016-12-15 and so on as a line chart
- Mark as New
- Bookmark
- Subscribe
- Mute
- Subscribe to RSS Feed
- Permalink
- Report Inappropriate Content
>>No qualified path for file: ***
Use the SQL statement to get data from a database table. You can use a preceding LOAD statement to then use QlikSense script functions. Assuming the datetime value is called DateTimeField:
LOAD *,
Date(Floor(DateTimeField)) as Date, // date from DateTimeField;
Interval(Round(Frac(DateTimeField), 1/1440), 'm') as TimeValue, // minutes in day (as a datetime numeric)
Minute(DateTimeField) as Minute; // minutes portion of hh:mm time
SQL SELECT *
From YourDataSourceTableName;
Adapt as required for the correct table and field names and SQL query.
- « Previous Replies
-
- 1
- 2
- Next Replies »