Unlock a world of possibilities! Login now and discover the exclusive benefits awaiting you.
- Qlik Community
- :
- All Forums
- :
- QlikView App Dev
- :
- Re: Link monthly historical average to MonthYear t...
- Subscribe to RSS Feed
- Mark Topic as New
- Mark Topic as Read
- Float this Topic for Current User
- Bookmark
- Subscribe
- Mute
- Printer Friendly Page
- Mark as New
- Bookmark
- Subscribe
- Mute
- Subscribe to RSS Feed
- Permalink
- Report Inappropriate Content
Link monthly historical average to MonthYear table
Hi there,
I'm looking for a way to link historical monthly averages to the below table.
Historically in November the rate was 0.596 so for the Plan Date of 1/11/2014 I want add this value.
Any ideas?
Thanks,

- Tags:
- qlikview_scripting
- « Previous Replies
-
- 1
- 2
- Next Replies »
- Mark as New
- Bookmark
- Subscribe
- Mute
- Subscribe to RSS Feed
- Permalink
- Report Inappropriate Content
Thanks Stefan,
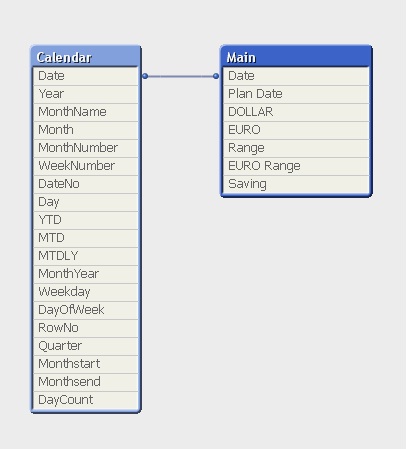
I don't believe the calendar is the issue e.g. both sets of data (table with historical rates and table with forecast) are linked to the same calendar. The complexity is telling QV to use a period e.g. Oct-14 and link that with the historical averages for the month of October. From the 'Table View' you can see that all dates used are nicely linked together.
- Mark as New
- Bookmark
- Subscribe
- Mute
- Subscribe to RSS Feed
- Permalink
- Report Inappropriate Content
yes thas correct, but u have concatenate and Plan Date only have a connection to Saving not to DOLLAR.
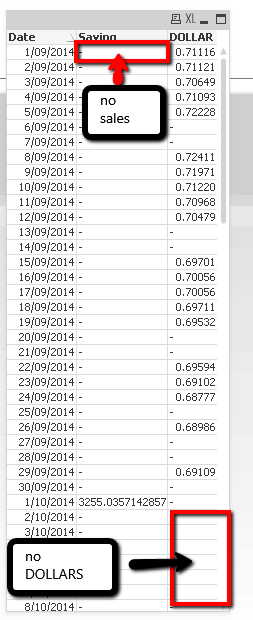
so when u use the dimension Plan Date u can´t show DOLLAR. Saving is also calculated on Month level and DOLLARS on (almost) every day. If u put in Date, saving and DOLLAR into a tablebox and select 2014, u will se that u dont have any sales before oct and no DOLLAR after end of sept.
- Mark as New
- Bookmark
- Subscribe
- Mute
- Subscribe to RSS Feed
- Permalink
- Report Inappropriate Content
New_Main:
Load
monthstart(Date) as [Plan Date], avg(DOLLAR) as DOLLAR, avg(EURO) as EURO, avg([EURO Range]) as [Euro Range] Resident Main Group by monthstart(Date); drop table Main;
do a resident Load on Main where u group by on same level as Sales
- Mark as New
- Bookmark
- Subscribe
- Mute
- Subscribe to RSS Feed
- Permalink
- Report Inappropriate Content
Thats not correct. Monthstart will only give any date value the first day of the month. So 1/26/2014 will be converted to 1/1/2014. Every row is evaluated like this. You therefore don't need group by if you dont want to, the rows are kept. It isessential QV logic you dont need to aggregate Data in your datamodel.
Month start on Exchange Rate Date would therefore work. But the set expression in the average calculation sets Year below 2009, so there won't be any exchange rate when you select a year above that and and add Plan Date as Dimension (DOLLARS in your data model have no plan date values, so qv cant display them). You can see this when you remove Plan Date from your Chart and do not select any year:

I don't know why you are calculating avg of dollars only for values before 2009? This won't work this way when you have a Date Dimension. But maybe you can specify how you want to connect the values to your Plan Dates?
Best regards
Stefan
- Mark as New
- Bookmark
- Subscribe
- Mute
- Subscribe to RSS Feed
- Permalink
- Report Inappropriate Content
Hi Stefan,
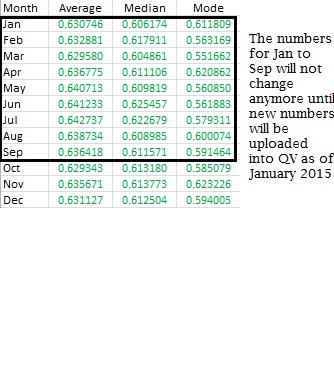
Answering your question "I don't know why you are calculating avg of dollars only for values before 2009?" my historical rates run from '99 to '14. Ideally these will be used to plot a forecasted rate in the future which runs parrallell to the forecast in value .e.g. the value for Jan '16 = $3,887 and average Rate in January = 0.586 but that's exactly the problem.
Today I tried to create some variables but that didn't work either. I don't want to create a separate Excel sheet where I enter the average rate similar to the example below. This time I want to use the power of QV.

- Mark as New
- Bookmark
- Subscribe
- Mute
- Subscribe to RSS Feed
- Permalink
- Report Inappropriate Content
Hi,
Ah Ok. So you want to calculate an average for each month based on the dollar values from 99 to 09 for each month?
Is this fixed for every year or do you want the average using the last x years depending on the selected year?
Can't test this now but I think in your case try to modify your avg calculation like this:
Avg ( total <Month> {< [Plan Date]= , Year = {"<=2009"} >} DOLLARS)
This should even work without modification to your script.
Best regards
Stefan
- Mark as New
- Bookmark
- Subscribe
- Mute
- Subscribe to RSS Feed
- Permalink
- Report Inappropriate Content
"So you want to calculate an average for each month based on the dollar values from 99 to 09 for each month?" Correct. See example below which is based on data by month from '99 to '14.
"Is this fixed for every year or do you want the average using the last x years depending on the selected year?" The average used should be based on the full historical information available.
- Mark as New
- Bookmark
- Subscribe
- Mute
- Subscribe to RSS Feed
- Permalink
- Report Inappropriate Content
this works with your sample app :
aggr(Avg ( total <Month> {< Year = , [Plan Date]= >} DOLLAR), Month, [Plan Date])

Hope this helps
Best regards
Stefan
- Mark as New
- Bookmark
- Subscribe
- Mute
- Subscribe to RSS Feed
- Permalink
- Report Inappropriate Content
Please close this discussion if this solution works for you!
- « Previous Replies
-
- 1
- 2
- Next Replies »