Unlock a world of possibilities! Login now and discover the exclusive benefits awaiting you.
- Qlik Community
- :
- All Forums
- :
- QlikView App Dev
- :
- Most Occurred
- Subscribe to RSS Feed
- Mark Topic as New
- Mark Topic as Read
- Float this Topic for Current User
- Bookmark
- Subscribe
- Mute
- Printer Friendly Page
- Mark as New
- Bookmark
- Subscribe
- Mute
- Subscribe to RSS Feed
- Permalink
- Report Inappropriate Content
Most Occurred
Hi All,
Facing an issue to get the below logic. Request your kind help in achieving it.
I have the following data.
| Dress Type | Weight | Price Type | Price | ID |
| Jeans | 50 KG | Wholesale Price | 100 | ID1 |
| Jeans | 50 KG | Wholesale Price | 200 | ID2 |
| Jeans | 50 KG | Wholesale Price | 100 | ID3 |
| Shirts | 50 KG | Wholesale Price | 100 | ID1 |
| Shirts | 50 KG | Wholesale Price | 200 | ID2 |
| Trousers | 100 Pound | Street Price | 300 | ID1 |
| Trousers | 100 Pound | Street Price | 300 | ID4 |
| Trousers | 100 Pound | Street Price | 200 | ID1 |
| Trousers | 100 Pound | Street Price | 400 | ID5 |
| Trousers | 100 Pound | Street Price | 400 | ID5 |
| Coat | 50 KG | Channel Price | 200 | ID2 |
| Coat | 50 KG | Channel Price | 200 | ID1 |
Based on the column Dress Type, Weight , Price Type and Price . I have to fetch the most occurred price and then count the ID for most occurrences.
Example :
For the Dress Type - Jeans the most occurred price is 100 so fetch the record and count the ID with Price 100 for Jeans.
For Shirts the Price is not repeated , so fetch two records for Shirts.
For Trousers most repeated price is 300 and 400 so fetch both the records and count the ID
For Coat ,as the Price is same for the records fetch the record and count the ID.
Final output will be as below:
| Dress Type | Weight | Price Type | Price | Count(ID) |
| Jeans | 50 KG | Wholesale Price | 100 | 2 |
| Shirts | 50 KG | Wholesale Price | 100 | 1 |
| Shirts | 50 KG | Wholesale Price | 200 | 1 |
| Trousers | 100 Pound | Street Price | 300 | 2 |
| Trousers | 100 Pound | Street Price | 400 | 2 |
| Coat | 50 KG | Channel Price | 200 | 2 |
Very thanks in advance.
Regards,
Alvin.
- Tags:
- qlikview_scripting
Accepted Solutions
- Mark as New
- Bookmark
- Subscribe
- Mute
- Subscribe to RSS Feed
- Permalink
- Report Inappropriate Content
What you are trying to achieve is a very simple task. Use the rank function available in QlikView.
Instructions:
Create a Straight Table Chart, and add [Dress Type], Weight, [Price Type] , Price as Dimensions , and then add just one Expression as follows (definition): IF (RANK (COUNT(ID),1,1) = 1, COUNT(ID))
The Engine will aggregate the values for you based on the dimensions up to Price. and the if is just to show all the 1 rank values.
Sometimes We think as programmers and then immediately go for the Code 🙂 and QlikView has plenty of functions, which We are all discovering on a daily basis.
- Mark as New
- Bookmark
- Subscribe
- Mute
- Subscribe to RSS Feed
- Permalink
- Report Inappropriate Content
Hi
Copy paste below code in script editor:
Table1:
LOAD * Inline
[
DressType,Weight,PriceType,Price,ID
Jeans,50 KG,Wholesale Price,100,ID1
Jeans,50 KG,Wholesale Price,200,ID2
Jeans,50 KG,Wholesale Price,100,ID3
Shirts,50 KG,Wholesale Price,100,ID1
Shirts,50 KG,Wholesale Price,200,ID2
Trousers,100 Pound,Street Price,300,ID1
Trousers,100 Pound,Street Price,300,ID4
Trousers,100 Pound,Street Price,200,ID1
Trousers,100 Pound,Street Price,400,ID5
Trousers,100 Pound,Street Price,400,ID5
Coat,50 KG,Channel Price,200,ID2
Coat,50 KG,Channel Price,200,ID1
];
LOAD DressType,Weight,PriceType,Price,
count(ID)as CountID
Resident Table1
Group by DressType,Weight,PriceType,Price;
add all fields (including CountID field) and expression:
Aggr(Count(ID),DressType,Weight,PriceType,Price)
in straight table:
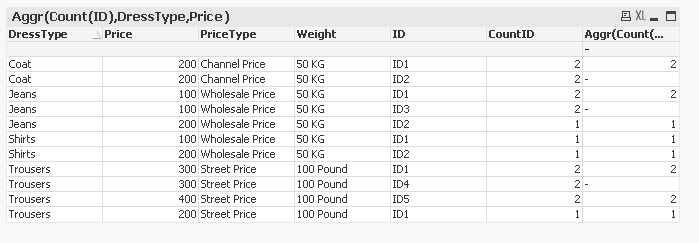
Hope either solution CountID field or expression:
Aggr(Count(ID),DressType,Weight,PriceType,Price)
hope it solves your query
Regards
Neetha
- Mark as New
- Bookmark
- Subscribe
- Mute
- Subscribe to RSS Feed
- Permalink
- Report Inappropriate Content
Hi Mario,
Thank you for your reply. It helped. There was a slight change in the requirement for one of the scenario in the data provided.
Current Output is :
| Dress Type | Weight | Price Type | Price | Count(ID) |
| Jeans | 50 KG | Wholesale Price | 100 | 2 |
| Shirts | 50 KG | Wholesale Price | 100 | 1 |
| Shirts | 50 KG | Wholesale Price | 200 | 1 |
| Trousers | 100 Pound | Street Price | 300 | 2 |
| Trousers | 100 Pound | Street Price | 400 | 2 |
| Coat | 50 KG | Channel Price | 200 | 2 |
Expected Output is :
The Only change in the logic is for Trousers as Dress Type, Weight , Price Type is same the Price has to be displayed as shown below. (for example-300-400)
| Dress Type | Weight | Price Type | Price | Count(ID) |
| Jeans | 50 KG | Wholesale Price | 100 | 2 |
| Shirts | 50 KG | Wholesale Price | 100 | 1 |
| Shirts | 50 KG | Wholesale Price | 200 | 1 |
| Trousers | 100 Pound | Street Price | 300-400 | 1 |
| Trousers | 100 Pound | Street Price | 301-400 | 1 |
| Coat | 50 KG | Channel Price | 200 | 2 |
Request help to achieve the above logic.
Regards,
Alvin.
- Mark as New
- Bookmark
- Subscribe
- Mute
- Subscribe to RSS Feed
- Permalink
- Report Inappropriate Content
Hi Neetha,
I don't want only to count the ID. Based on the most occurred values the display of the values is also different.
Kindly refer to my discussion.
Thank you for your reply...
Regards,
Alvin.