Unlock a world of possibilities! Login now and discover the exclusive benefits awaiting you.
- Qlik Community
- :
- All Forums
- :
- QlikView App Dev
- :
- My Dimension Expression error unable to make all m...
- Subscribe to RSS Feed
- Mark Topic as New
- Mark Topic as Read
- Float this Topic for Current User
- Bookmark
- Subscribe
- Mute
- Printer Friendly Page
- Mark as New
- Bookmark
- Subscribe
- Mute
- Subscribe to RSS Feed
- Permalink
- Report Inappropriate Content
My Dimension Expression error unable to make all my Bar same height.
Hi All
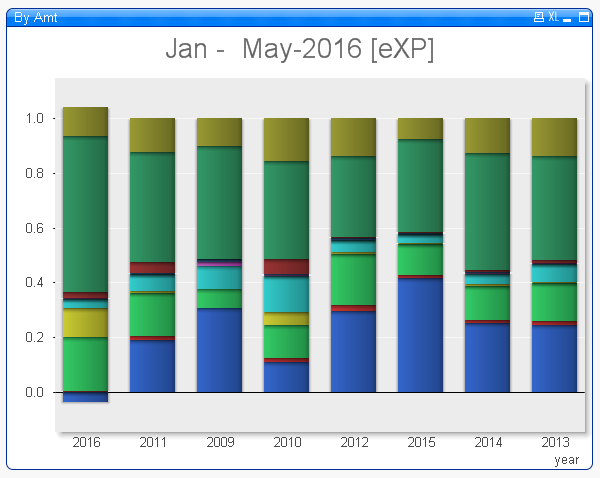
I have a Bar Chart which display Expense by year stack with different expense type.
I want to make the Bar same height . So that i can view the % contribution by expense type.
My expression as below is okay :-
Sum({<eXP={eXP}>}Amount/1000)
My issue is I try the below but it does not work, mostly likely is the area i mark red :-
=if(aggr(sum({<eXP={eXP}>}Amount*-1),$(ColumnDim101)) / aggr(sum(total <$(ColumnDim_p)> {<eXP={eXP}>}Amount*-1), $(ColumnDim101)) > 0.001, $(ColumnDim101), 'OTHERS')
Now the chart is display the total expense by year. Hope some one can share with me.
PAul
- Tags:
- qlikview_scripting
Accepted Solutions
- Mark as New
- Bookmark
- Subscribe
- Mute
- Subscribe to RSS Feed
- Permalink
- Report Inappropriate Content
May be this:
Sum({<eXP={eXP}>}Amount*-1)/Sum(total <$(ColumnDim_p)> {<eXP={eXP}>}Amount*-1)
- Mark as New
- Bookmark
- Subscribe
- Mute
- Subscribe to RSS Feed
- Permalink
- Report Inappropriate Content
my qv doc
- Mark as New
- Bookmark
- Subscribe
- Mute
- Subscribe to RSS Feed
- Permalink
- Report Inappropriate Content
Sorry, if my understand is not correct. I can see only following expression at your attachement
Sum({<eXP={eXP}>}Amount*-1)
I just changed it to
Sum({<eXP={eXP}>}Amount*-1)
/
Sum({<eXP={eXP}>}Amount)
now you can see your chart 100% contribution. this way you can change your required expression.
if not please share your business logic.
HTH
Thanks
PR
- Mark as New
- Bookmark
- Subscribe
- Mute
- Subscribe to RSS Feed
- Permalink
- Report Inappropriate Content
Hi Prasanna
Yes all the bar chart now same height , did you notice that all bar are same height. So it is wrong. the issue is on the dimension expression.
Paul
- Mark as New
- Bookmark
- Subscribe
- Mute
- Subscribe to RSS Feed
- Permalink
- Report Inappropriate Content
May be this:
Sum({<eXP={eXP}>}Amount*-1)/Sum(total <$(ColumnDim_p)> {<eXP={eXP}>}Amount*-1)
- Mark as New
- Bookmark
- Subscribe
- Mute
- Subscribe to RSS Feed
- Permalink
- Report Inappropriate Content
Hi Sunny
thank you very much
Paul