Unlock a world of possibilities! Login now and discover the exclusive benefits awaiting you.
- Qlik Community
- :
- All Forums
- :
- QlikView App Dev
- :
- Re: Need help with expression
- Subscribe to RSS Feed
- Mark Topic as New
- Mark Topic as Read
- Float this Topic for Current User
- Bookmark
- Subscribe
- Mute
- Printer Friendly Page
- Mark as New
- Bookmark
- Subscribe
- Mute
- Subscribe to RSS Feed
- Permalink
- Report Inappropriate Content
Need help with expression
Hi all!
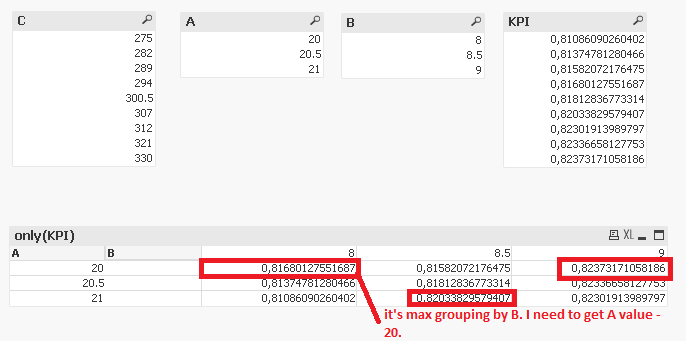
Here is my problem: I have two dimensions, A and B, and I have data C: C=AxB (there is C value for each pair (A,B)). Also, I have a formula: KPI=A*1000/(C*10*B). So, I have to get A-values, for which KPI, calcuted with grouping by B field, is MAX.
I know how to calculate MAX KPI grouping by B field:
=aggr(max(aggr(A*1000/(C*9.81*B),A,B)),B),
but how to get B value?
Accepted Solutions
- Mark as New
- Bookmark
- Subscribe
- Mute
- Subscribe to RSS Feed
- Permalink
- Report Inappropriate Content
- Mark as New
- Bookmark
- Subscribe
- Mute
- Subscribe to RSS Feed
- Permalink
- Report Inappropriate Content
Can you provide some sample data with expected output to try out what you are looking for?
- Mark as New
- Bookmark
- Subscribe
- Mute
- Subscribe to RSS Feed
- Permalink
- Report Inappropriate Content
Hi, Sunny T!
Thak you for your attention!
First thing I have to edit my question: " but how to get A value?"
Here is the data to load:
LOAD A, B, C,
A*1000/(C*9.81*B) as KPI
INLINE
[A, B, C
20, 8, 312
20.5, 8, 321
21, 8, 330
20, 8.5, 294
20.5, 8.5, 300.5
21, 8.5, 307
20, 9, 275
20.5, 9, 282
21, 9, 289]
I decided to calculated KPI already in script.
So here is what we have (pivot table for better understanding). I want to get something like this:
newA newB
20 8
21 8,5
20 9
I need newA and newB for my linear diagram.
- Mark as New
- Bookmark
- Subscribe
- Mute
- Subscribe to RSS Feed
- Permalink
- Report Inappropriate Content
Are you looking for this?
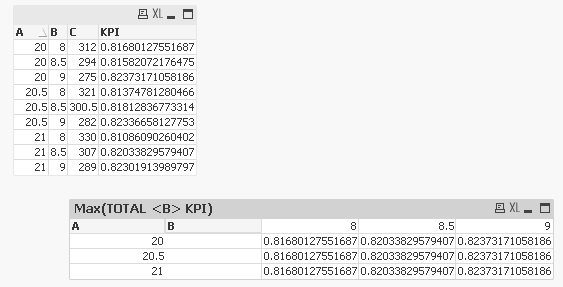
Expression: Max(TOTAL <B> KPI)
- Mark as New
- Bookmark
- Subscribe
- Mute
- Subscribe to RSS Feed
- Permalink
- Report Inappropriate Content
Exactly!
Thank you very much!
- Mark as New
- Bookmark
- Subscribe
- Mute
- Subscribe to RSS Feed
- Permalink
- Report Inappropriate Content
If your question is now answered, please flag the Correct Answer and possible Helpful Answers.
If not, please make clear what part of this topic you still want discussion on  .
.
- Mark as New
- Bookmark
- Subscribe
- Mute
- Subscribe to RSS Feed
- Permalink
- Report Inappropriate Content
Hi!
Thanks for help once more:) But I still can't build what I want..
My purpose is a linear diagram: horizontal axis(dimension) - B, and expression should return optimal A (A, where we have max(KPI) grouping by B).
Output for sample data I gave above mentioned to be like this (in numeric view):
B - 8, A - 20
B - 8.5, A - 21
B - 9, A - 20.
Is it possible?
- Mark as New
- Bookmark
- Subscribe
- Mute
- Subscribe to RSS Feed
- Permalink
- Report Inappropriate Content
This?
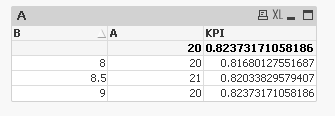
Dimension: B
Expressions
1) =FirstSortedValue(A, -KPI)
2) =Max(KPI)
- Mark as New
- Bookmark
- Subscribe
- Mute
- Subscribe to RSS Feed
- Permalink
- Report Inappropriate Content
Thank you! Now it works!