Unlock a world of possibilities! Login now and discover the exclusive benefits awaiting you.
- Qlik Community
- :
- All Forums
- :
- QlikView App Dev
- :
- Need to plot max week/month value
- Subscribe to RSS Feed
- Mark Topic as New
- Mark Topic as Read
- Float this Topic for Current User
- Bookmark
- Subscribe
- Mute
- Printer Friendly Page
- Mark as New
- Bookmark
- Subscribe
- Mute
- Subscribe to RSS Feed
- Permalink
- Report Inappropriate Content
Need to plot max week/month value
Hi All,
I plotted a bar chart with -
Date/Week/Month/Quarter - as my Dimension (cyclic group)
Sum(CNT) - as my Expression
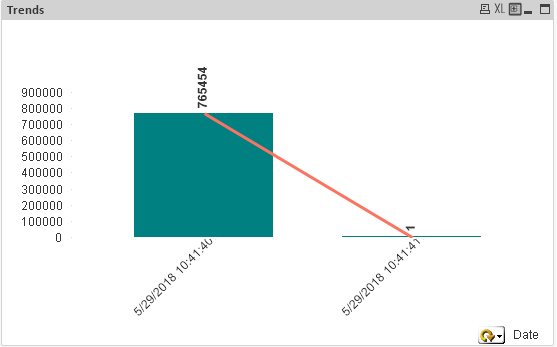
Now, the chart will look somewhat like(sample):
Now, if someone will change the cyclic group to Month/Week/ Quarter, it will automatically sum up all the values for that and will show the sum as a count.
But, the client needs me to show in the following way:
If a week is selected in x-axis - The bars for all the weeks shall show the max(date's) value for that week
If a month is selected in x-axis - The bars for all the months shall show the max(date's) value for that month...
Like for the above chart,
if the cyclic group is changed to month,
then it shall show
x-axis - May
y-axis - 1 (not 765454)
Hope I am able to explain my requirement here. Thanks.
- Tags:
- qlikview_scripting
- Mark as New
- Bookmark
- Subscribe
- Mute
- Subscribe to RSS Feed
- Permalink
- Report Inappropriate Content
Look here