Unlock a world of possibilities! Login now and discover the exclusive benefits awaiting you.
- Qlik Community
- :
- All Forums
- :
- QlikView App Dev
- :
- Re: Pivot table how to sort hi to lo for 2015 year...
- Subscribe to RSS Feed
- Mark Topic as New
- Mark Topic as Read
- Float this Topic for Current User
- Bookmark
- Subscribe
- Mute
- Printer Friendly Page
- Mark as New
- Bookmark
- Subscribe
- Mute
- Subscribe to RSS Feed
- Permalink
- Report Inappropriate Content
Pivot table how to sort hi to lo for 2015 year column ?
Hi All
How to sort hi to lo for this table 1 For 2015 column ?
Paul
- Tags:
- qlikview_scripting
Accepted Solutions
- Mark as New
- Bookmark
- Subscribe
- Mute
- Subscribe to RSS Feed
- Permalink
- Report Inappropriate Content
Hi,
Try like this
Chart Properties -> Sort -> Select Dimension -> Select Expression and give below expression and select Descending
=sum({$< year={$(=Max(Year))}, month=,MonthSeqNum = {"$(= '>=' & only(MonthSeqNum-7) & '<=' & only(MonthSeqNum))"} >} Amount*-1/$(ColumnDim98)/1000)
Hope this helps you.
Regards,
Jagan.
- Mark as New
- Bookmark
- Subscribe
- Mute
- Subscribe to RSS Feed
- Permalink
- Report Inappropriate Content
Enclosed my QV Doc
- Mark as New
- Bookmark
- Subscribe
- Mute
- Subscribe to RSS Feed
- Permalink
- Report Inappropriate Content
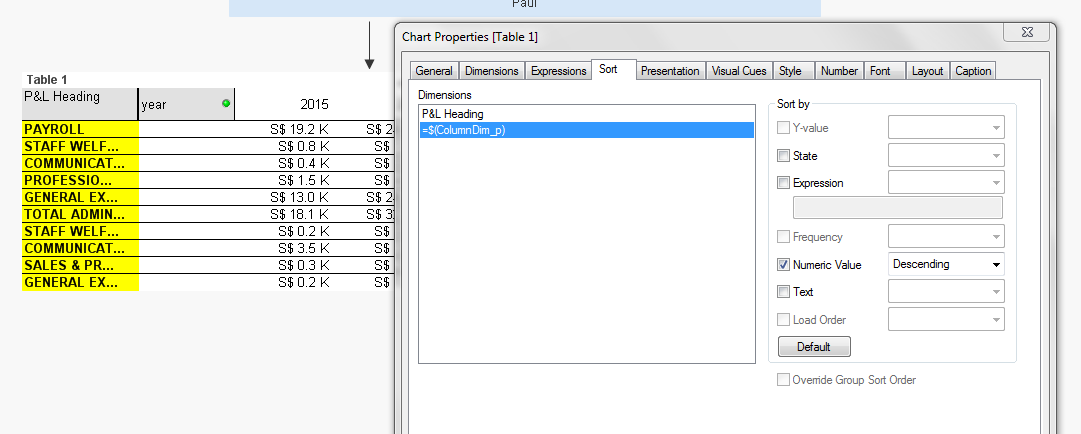
go to properties of the chart and on the sort tab.
- Mark as New
- Bookmark
- Subscribe
- Mute
- Subscribe to RSS Feed
- Permalink
- Report Inappropriate Content
Hi Sir
it does not work.
Paul
- Mark as New
- Bookmark
- Subscribe
- Mute
- Subscribe to RSS Feed
- Permalink
- Report Inappropriate Content
see the attached app.
- Mark as New
- Bookmark
- Subscribe
- Mute
- Subscribe to RSS Feed
- Permalink
- Report Inappropriate Content
Hi Sir
what i mean is i like the amount sort from hi to lo , look like below :-
| P&L Heading | year | 2,015.00 | 2,014.00 |
| PAYROLL | 19.23 | 24.59 | |
| TOTAL ADMIN EXPENSES | 18.07 | 32.56 | |
| GENERAL EXPENSES - ADMIN | 13.03 | 24.17 | |
| COMMUNICATION - S & D | 3.55 | 3.15 | |
| PROFESSIONAL FEE - ADMIN | 1.49 | 4.23 | |
| STAFF WELFARE - ADMIN | 0.81 | 1.57 | |
| COMMUNICATION - ADMIN | 0.40 | 0.47 | |
| SALES & PROMOTION - S & D | 0.29 | 2.89 | |
| GENERAL EXPENSES - S & D | 0.23 | 1.18 | |
| STAFF WELFARE - S & D | 0.20 | 0.64 |
- Mark as New
- Bookmark
- Subscribe
- Mute
- Subscribe to RSS Feed
- Permalink
- Report Inappropriate Content
I don't think its possible to sort it by Y-value on the pivot table.
- Mark as New
- Bookmark
- Subscribe
- Mute
- Subscribe to RSS Feed
- Permalink
- Report Inappropriate Content
Hi
class function and dual:
this is used to without field select add calculation dimension and when null value to select 'suppress when value is
null .
example : dual is consider the numeric and text.
dual(class([ordertotal],1000),class([ordertotal],1000),
sort tab select numeric values .
try once
Thanks,
srinu
- Mark as New
- Bookmark
- Subscribe
- Mute
- Subscribe to RSS Feed
- Permalink
- Report Inappropriate Content
Hi,
Try like this
Chart Properties -> Sort -> Select Dimension -> Select Expression and give below expression and select Descending
=sum({$< year={$(=Max(Year))}, month=,MonthSeqNum = {"$(= '>=' & only(MonthSeqNum-7) & '<=' & only(MonthSeqNum))"} >} Amount*-1/$(ColumnDim98)/1000)
Hope this helps you.
Regards,
Jagan.
- Mark as New
- Bookmark
- Subscribe
- Mute
- Subscribe to RSS Feed
- Permalink
- Report Inappropriate Content
Check this app
Use like the below expr on P&L Heading in Sort tab
Sum({<Year={2015}>}Sales)