Unlock a world of possibilities! Login now and discover the exclusive benefits awaiting you.
- Qlik Community
- :
- All Forums
- :
- QlikView App Dev
- :
- Re: Quantile calculation with non numeric first di...
- Subscribe to RSS Feed
- Mark Topic as New
- Mark Topic as Read
- Float this Topic for Current User
- Bookmark
- Subscribe
- Mute
- Printer Friendly Page
- Mark as New
- Bookmark
- Subscribe
- Mute
- Subscribe to RSS Feed
- Permalink
- Report Inappropriate Content
Quantile calculation with non numeric first dimension
Hi all,
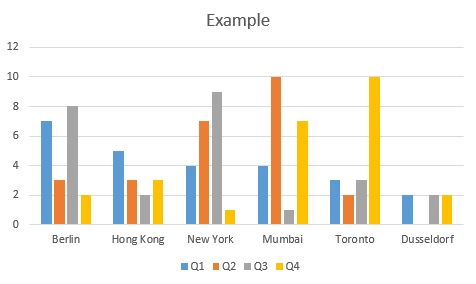
I am trying to create a bar chart displaying the amounts of businesses in each city sorted by quantiles depending on their revenue (please see graph below).
I am guessing the steps in the formula would be:
Step 1: Rank the 100 companies in my sample by revenue (largest to smallest).
Step 2: Define 4 quantiles (each consisting of 25 companies)
Step 3: Count how often each city is represented in each quantile and end up with a bar chart (such as below)
I assume there has to be a formula doing all that work but unfortunately I have not quite figured it out.
I am very grateful for anyone helping me out!
Thank you!
- Mark as New
- Bookmark
- Subscribe
- Mute
- Subscribe to RSS Feed
- Permalink
- Report Inappropriate Content
Can you share some data that you you used to post the bar chart above ? if you have the data and desired output that would help me .
- Mark as New
- Bookmark
- Subscribe
- Mute
- Subscribe to RSS Feed
- Permalink
- Report Inappropriate Content
Hello Jonathan,
please excuse my late response. We found a way to solve the problem. Thanks for your post.
Greetings
Alex