Unlock a world of possibilities! Login now and discover the exclusive benefits awaiting you.
- Qlik Community
- :
- All Forums
- :
- QlikView App Dev
- :
- Re: Rolling correlations
- Subscribe to RSS Feed
- Mark Topic as New
- Mark Topic as Read
- Float this Topic for Current User
- Bookmark
- Subscribe
- Mute
- Printer Friendly Page
- Mark as New
- Bookmark
- Subscribe
- Mute
- Subscribe to RSS Feed
- Permalink
- Report Inappropriate Content
Rolling correlations
Hi all,
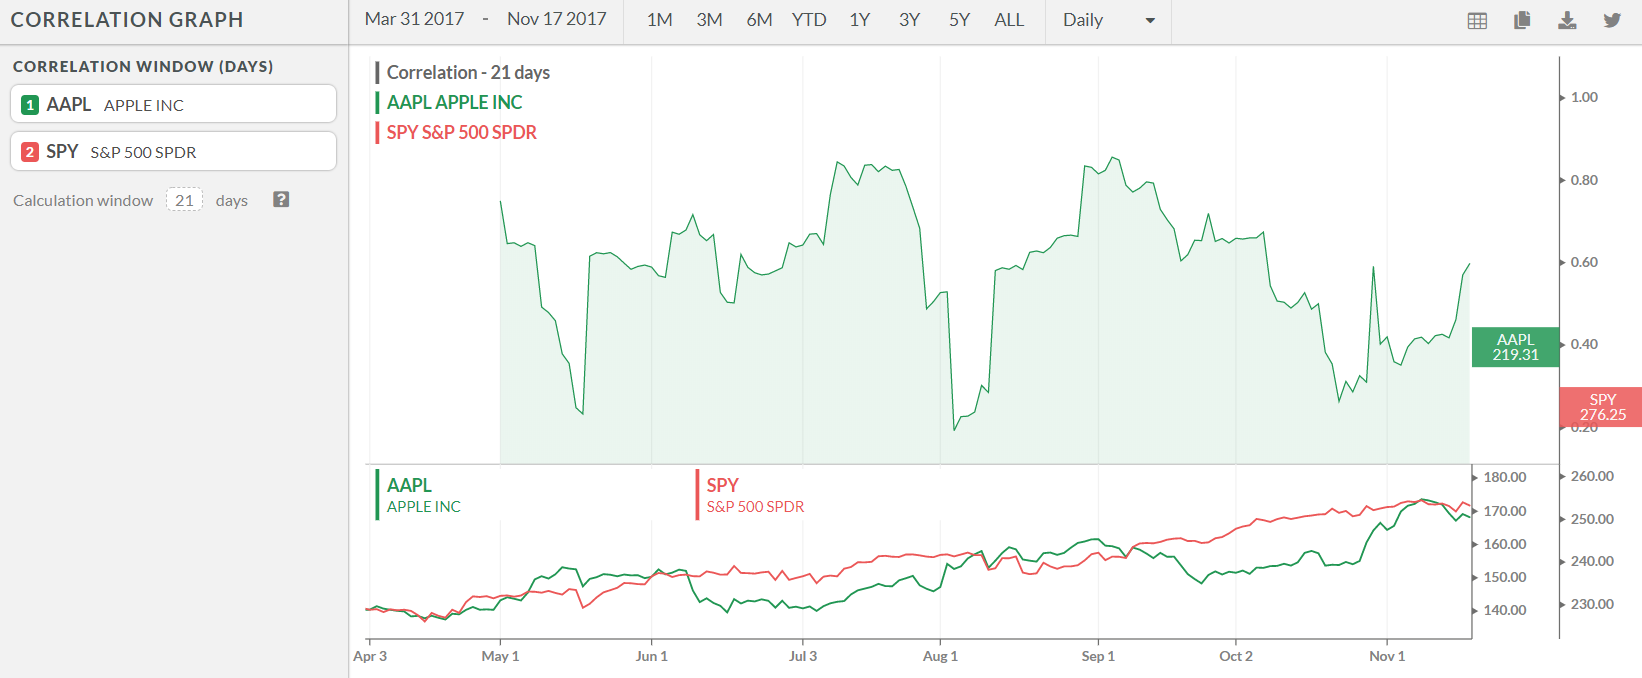
I wanted to know if it is possible to do a rolling correlations chart like that which is available on the financial app Koyfin?
Below is a screenshot where AAPL (Apple) has been chosen to be compared with SPY (S&P 500 index). The bottom line chart is the time series of daily share price for both but the chart above is a rolling correlation chart with a look back period (N) of 21 days.
I wanted to know if there was a way to do something like this on time series data in QlikView or Qlik Sense so that you can choose N amount of look back days?
Please help - thank you!
Accepted Solutions
- Mark as New
- Bookmark
- Subscribe
- Mute
- Subscribe to RSS Feed
- Permalink
- Report Inappropriate Content
maybe you could use an expression like
RangeCorrel(Above([Stock 1],0,21),Above([Stock 2],0,21))
?
hope this helps
regards
Marco
- Mark as New
- Bookmark
- Subscribe
- Mute
- Subscribe to RSS Feed
- Permalink
- Report Inappropriate Content
Hi,
Hard to define without seeing your exact data, but using RangeSum() and Above() is a good bet.
Something like
Avg(RangeSum(Above(Sum(YourValue),0,vDaysToAverage))) Should work, where YourValue is the value you are calculating and vDaysToAverage is over how many days the average is for.
Hope it helps!
- Mark as New
- Bookmark
- Subscribe
- Mute
- Subscribe to RSS Feed
- Permalink
- Report Inappropriate Content
please post some sample data and your expected result.
- Mark as New
- Bookmark
- Subscribe
- Mute
- Subscribe to RSS Feed
- Permalink
- Report Inappropriate Content
Hi all,
Thanks for the replies. Please find attached an example time series with 2 stocks in there (it's not for the image above as that was just a screenshot from an app where I'd seen this being done).
Here's the data.
- Mark as New
- Bookmark
- Subscribe
- Mute
- Subscribe to RSS Feed
- Permalink
- Report Inappropriate Content
maybe you could use an expression like
RangeCorrel(Above([Stock 1],0,21),Above([Stock 2],0,21))
?
hope this helps
regards
Marco
- Mark as New
- Bookmark
- Subscribe
- Mute
- Subscribe to RSS Feed
- Permalink
- Report Inappropriate Content
Thanks everyone - the RangeCorrel works a treat.