Unlock a world of possibilities! Login now and discover the exclusive benefits awaiting you.
- Qlik Community
- :
- All Forums
- :
- QlikView App Dev
- :
- Rolling window comparision
- Subscribe to RSS Feed
- Mark Topic as New
- Mark Topic as Read
- Float this Topic for Current User
- Bookmark
- Subscribe
- Mute
- Printer Friendly Page
- Mark as New
- Bookmark
- Subscribe
- Mute
- Subscribe to RSS Feed
- Permalink
- Report Inappropriate Content
Rolling window comparision
Hi All,
I wanted to create a table which will compare the metrics value with current year/quarter, previous year/quarter and previous to previous quarter based on user selection.
Please refer below screenshot which is created in Power-Pivot -
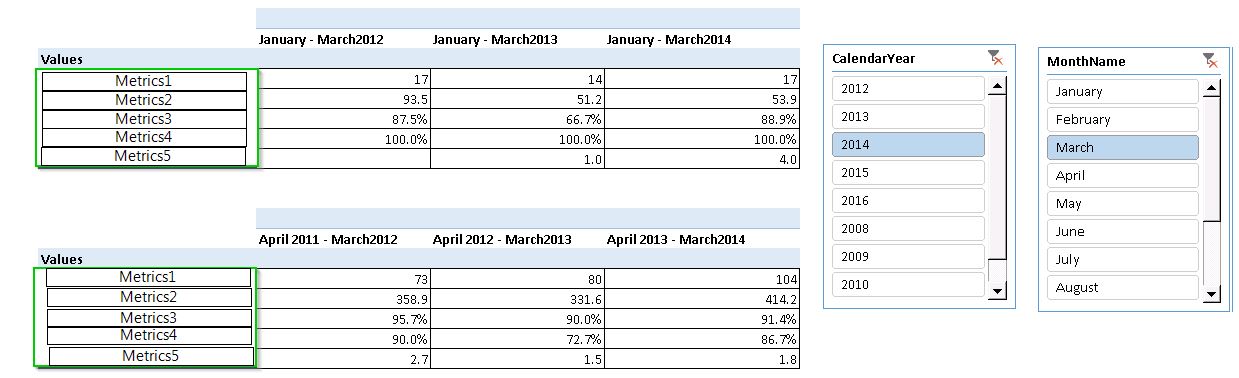
User selection => Calendar Year = 2014 and Month-Name = 'March'.
First table shows data Quarter-wise where-in [March is the end interval]
I should see data from January to March for current year(2014), same period last year and last to last year.
Second table shows data Year-wise where-in [March is the end interval]
I should see data from April to March for current year(2013-14), same period last year and last to last year.
I am able to write Set Analysis Expression for calculating data Year-wise using the following Set Analysis -
Sum({<[Calendar Year] = {$(=ONLY([Calendar Year]) - 1)}>}[Metrics1]) -- Previous Year
Sum({<[Calendar Year] = {$(=ONLY([Calendar Year]) - 1)}>}[Metrics1]) -- Previous to Previous Year
But I am not sure how to use Month Name in order to go back for last 3 months. I tried below expression
Sum({<[MonthName]={'>=$(=MAX([MonthName])-2)<=$(=MAX([MonthName]))'}>}[Metrics1]).
Also, how to handle the Jan and Feb month where-in we need to go back an year. Like, when I select Feb 2012, then I should see data from Dec 2011 to Feb 2012.
Thank you for your help.
- Mark as New
- Bookmark
- Subscribe
- Mute
- Subscribe to RSS Feed
- Permalink
- Report Inappropriate Content
You can't use a month name for this. April comes after March, but not sorted alphabetically. And it doesn't get you across year borders. You need to use a serial month number for this or a date field.
LOAD
MyDate,
Year(MyDate)*12+Month(MyDate) as MonthSerial,
....other fields....
FROM
...
Then you can do things like
sum({<Year=,Month=,MonthSerial={'>=$(Max(MonthSerial)-2)<=$(Max(MonthSerial))'}>}Metric1)
talk is cheap, supply exceeds demand
- Mark as New
- Bookmark
- Subscribe
- Mute
- Subscribe to RSS Feed
- Permalink
- Report Inappropriate Content
Hi Gysbert,
Even after using MonthSerial column in Set Analysis expression, I can't see the aggregated value of last 3 months when I select month name from MonthName column.
sum({<Year=,Month=,MonthSerial={'>=$(Max(MonthSerial)-2)<=$(Max(MonthSerial))'}>}[Metric1])
- Mark as New
- Bookmark
- Subscribe
- Mute
- Subscribe to RSS Feed
- Permalink
- Report Inappropriate Content
Post a small qlikview document that demonstrates the problem.
talk is cheap, supply exceeds demand
- Mark as New
- Bookmark
- Subscribe
- Mute
- Subscribe to RSS Feed
- Permalink
- Report Inappropriate Content
Hi Gysbert,
It worked. 
Can you please tell me how to generate those Table Headers [April 2013 - March 2014] dynamically?
And which chart component would you recommend to create above table? Currently I am using KPI's only