Unlock a world of possibilities! Login now and discover the exclusive benefits awaiting you.
- Qlik Community
- :
- All Forums
- :
- QlikView App Dev
- :
- Set Analysis to display new record in a text box o...
- Subscribe to RSS Feed
- Mark Topic as New
- Mark Topic as Read
- Float this Topic for Current User
- Bookmark
- Subscribe
- Mute
- Printer Friendly Page
- Mark as New
- Bookmark
- Subscribe
- Mute
- Subscribe to RSS Feed
- Permalink
- Report Inappropriate Content
Set Analysis to display new record in a text box object
HI guys,
I am following this post regarding how to use set analysis for new record. I was following 1 of the sample:
How to check if Record exist in Previous Month ? | Qlik Community
in the straight table expression, it is written as:
IF(COUNT({<batch_year = {'<$(=Max(batch_year))'}, risk_item_id = P({<risk_item_id>})>}risk_item_id)>0,'NO','YES')
I wonder how can i change or convert this line of code to show me amount of new records in text box object.
Rgds,
Jim
- Tags:
- qlikview_scripting
- « Previous Replies
-
- 1
- 2
- Next Replies »
- Mark as New
- Bookmark
- Subscribe
- Mute
- Subscribe to RSS Feed
- Permalink
- Report Inappropriate Content
Do you just have risk_item_id as your dimension or more? I am assuming you only have 1, but if you have more than 1, then add that to the aggr function below. This will count all the YESs.
Sum(Aggr(If(Count({<batch_year = {'<$(=Max(batch_year))'}, risk_item_id = P({<risk_item_id>})>}risk_item_id)>0,0,1), risk_item_id))
or this as risk_item_id = P({<risk_item_id>}) is not really needed here
Sum(Aggr(If(Count({<batch_year = {'<$(=Max(batch_year))'}>}risk_item_id)>0,0,1), risk_item_id))
- Mark as New
- Bookmark
- Subscribe
- Mute
- Subscribe to RSS Feed
- Permalink
- Report Inappropriate Content
I have tried this bro.. but it is still giving me 0 value....
What do you mean if i am using only risk_iem_id as dimension or more? any exmaples?
Sum(Aggr(If(Count({<batch_year = {'<$(=Max(batch_year))'}, risk_item_id = P({<risk_item_id>})>}risk_item_id)>0,0,1), risk_item_id))
- Mark as New
- Bookmark
- Subscribe
- Mute
- Subscribe to RSS Feed
- Permalink
- Report Inappropriate Content
Did you try the expression you gave in a straight table? and it gave you the YES at the right places?
- Mark as New
- Bookmark
- Subscribe
- Mute
- Subscribe to RSS Feed
- Permalink
- Report Inappropriate Content
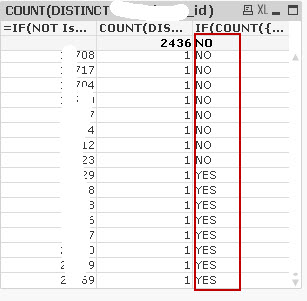
yes bro. with expression:
IF(COUNT({<batch_year = {'<$(=Max(batch_year))'}, risk_item_id = P({<risk_item_id>})>}risk_item_id)>0,'NO','YES')
- Mark as New
- Bookmark
- Subscribe
- Mute
- Subscribe to RSS Feed
- Permalink
- Report Inappropriate Content
but i just couldnt chnage to and use it on a textbox to diplay me number of new records.
- Mark as New
- Bookmark
- Subscribe
- Mute
- Subscribe to RSS Feed
- Permalink
- Report Inappropriate Content
What all dimensions are there in your chart? Can you list there names?
- Mark as New
- Bookmark
- Subscribe
- Mute
- Subscribe to RSS Feed
- Permalink
- Report Inappropriate Content
Sunny,
straight table chart using 1 calculated dimension:
=IF(NOT IsNull(batch_year),risk_item_id)
- Mark as New
- Bookmark
- Subscribe
- Mute
- Subscribe to RSS Feed
- Permalink
- Report Inappropriate Content
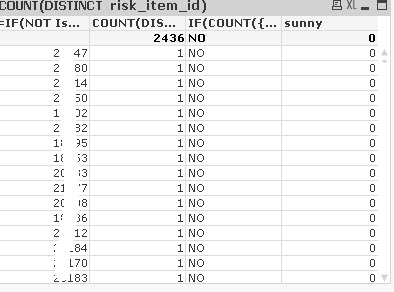
Then this should have worked:
Sum(Aggr(If(Count({<batch_year = {'<$(=Max(batch_year))'}, risk_item_id = P({<risk_item_id>})>}risk_item_id)>0,0,1), risk_item_id))
can you put this expression (next to your current expression for YES and NO) in the straight table and see what you are getting?
- Mark as New
- Bookmark
- Subscribe
- Mute
- Subscribe to RSS Feed
- Permalink
- Report Inappropriate Content
bro, it still gives me zero values. for no and yes.
- « Previous Replies
-
- 1
- 2
- Next Replies »