Unlock a world of possibilities! Login now and discover the exclusive benefits awaiting you.
- Qlik Community
- :
- All Forums
- :
- QlikView App Dev
- :
- Set Expression working in Table not work in chart ...
- Subscribe to RSS Feed
- Mark Topic as New
- Mark Topic as Read
- Float this Topic for Current User
- Bookmark
- Subscribe
- Mute
- Printer Friendly Page
- Mark as New
- Bookmark
- Subscribe
- Mute
- Subscribe to RSS Feed
- Permalink
- Report Inappropriate Content
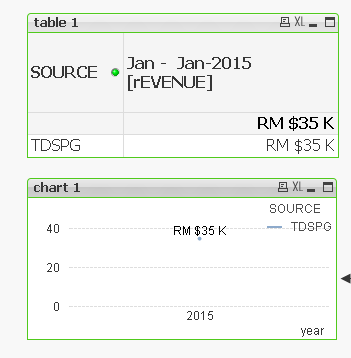
Set Expression working in Table not work in chart ?
Hi All
Table 1 Expression below , Display Amount RM 35K is correct :-
money(
SUM({<year = {"$(=Max(year)-0)"},month={"<=$(=month)"},$(ColumnDim51)={$(ColumnDim51)}>}Amount*1)/$(Columndim89)/1000,
$(vMoneyFormatK))
How to make below expression from chart 1 also display RM 35K same as Table 1 ?
money(
SUM({<year = {"$(=Max(year)-0)"},$(ColumnDim51)={$(ColumnDim51)}>}Amount*1/$(Columndim89)/1000)
,$(vMoneyFormatK))
Now it display RM 140K, Hope some one can advise me.
In my next post , i will post my QV Doc
Paul
- Tags:
- qlikview_scripting
Accepted Solutions
- Mark as New
- Bookmark
- Subscribe
- Mute
- Subscribe to RSS Feed
- Permalink
- Report Inappropriate Content
May be this;
Money(Sum(DISTINCT{<year = {"$(=Max(year)-0)"},$(ColumnDim51) ={$(ColumnDim51)}>} Amount*1/ $(Columndim89)/1000), $(vMoneyFormatK))
- Mark as New
- Bookmark
- Subscribe
- Mute
- Subscribe to RSS Feed
- Permalink
- Report Inappropriate Content
My QV Doc
- Mark as New
- Bookmark
- Subscribe
- Mute
- Subscribe to RSS Feed
- Permalink
- Report Inappropriate Content
May be this;
Money(Sum(DISTINCT{<year = {"$(=Max(year)-0)"},$(ColumnDim51) ={$(ColumnDim51)}>} Amount*1/ $(Columndim89)/1000), $(vMoneyFormatK))
- Mark as New
- Bookmark
- Subscribe
- Mute
- Subscribe to RSS Feed
- Permalink
- Report Inappropriate Content
Hi Summy
Many thank for your help. Your expression is working fine.
But the chart still have little issue. when i try to display chart for whole year from jan till Dec. the currency sign not work when i set to Org.
Enclosed My QV Doc for your ref
Paul