Unlock a world of possibilities! Login now and discover the exclusive benefits awaiting you.
- Qlik Community
- :
- All Forums
- :
- QlikView App Dev
- :
- Set analysis - only retrieve the last line for a r...
- Subscribe to RSS Feed
- Mark Topic as New
- Mark Topic as Read
- Float this Topic for Current User
- Bookmark
- Subscribe
- Mute
- Printer Friendly Page
- Mark as New
- Bookmark
- Subscribe
- Mute
- Subscribe to RSS Feed
- Permalink
- Report Inappropriate Content
Set analysis - only retrieve the last line for a reference
Hello,
I have set up a chart that counts a number of tickets in support entries per day, per week, per month (based on a single criteria) from a complex table containing all entries, knowing that a ticket can enter (and exit) several times over the same period.
My source table has this form:
Comment | Row id | Référence | date | In/out flag | status | status_flag | group | group_flag |
Creation of the ticket | 10102 | 1025639 | 09/11/2017 14:00:00 | I | open | 1 | Grp1 | 1 |
Change of group | 10256 | 1025639 | 09/11/2017 15:00:00 | O | open | 0 | Grp1 | 1 |
10365 | 1025639 | 09/11/2017 15:00:00 | I | open | 0 | Grp 2 | 1 | |
Change of status | 10459 | 1025639 | 09/12/2017 15:10:00 | O | open | 1 | Grp 2 | 0 |
10468 | 1025639 | 09/12/2017 15:10:00 | I | InProgress | 1 | Grp 2 | 0 | |
Change of group | 10596 | 1025639 | 09/13/2017 15:30:00 | O | InProgress | 0 | Grp 2 | 1 |
10599 | 1025639 | 09/13/2017 15:30:00 | I | InProgress | 0 | Grp 3 | 1 | |
Change of status | 10601 | 1025639 | 09/14/2017 09:30:00 | O | Resolved | 1 | Grp 3 | 0 |
10602 | 1025639 | 09/14/2017 09:30:00 | I | Resolved | 1 | Grp 3 | 0 | |
Change of group | 10605 | 1025639 | 09/14/2017 12:30:00 | O | Resolved | 0 | Grp 3 | 1 |
10607 | 1025639 | 09/14/2017 12:30:00 | I | Resolved | 0 | Grp 2 | 1 | |
... |
Note: the flag lets you know on which field the entry is to count(group, status, application, etc.)
I try to count the number of entries per group
My expression is 'rather' simple:
= count {{in_out = {'E'}, group = p (group_name)>} DISTINCT if (group_flag, reference)
that works well. the Distinct does count me only one ticket even if it has been assigned twice in September to the Gpe2.
The problem happens when I want to show status when receiving tickets.
There it counts 1 for the status Open and 1 for the status Resolved.
I only want to count the first (or last) entry I have
So get the min (date) of my entries to have only one line (and no need to make a distinct anymore).
Of course, I thought of the solution in the LOAD, but it's a dynamic screen and I can not pre-calculate everything.
Thanks in advance for your help.
Regards
FG
- Tags:
- qlikview_scripting
- Mark as New
- Bookmark
- Subscribe
- Mute
- Subscribe to RSS Feed
- Permalink
- Report Inappropriate Content
Sorry I could able to grasp bits and pieces of the information you have provided. Can you give us some sample data with an expected output? may be you can use Firstsortedvalue().
- Mark as New
- Bookmark
- Subscribe
- Mute
- Subscribe to RSS Feed
- Permalink
- Report Inappropriate Content
My problem is that i have different sums when my graph use a dynamic dimension.
I try to use Firstsortedvalue() but i don't succeed (but perhaps i don't how to use it correctly).
My expectation is to have in the result of the set analyse, one and only one row per ticket, whatever the dimension(s) used.
so in my example, if i want to display the ticket in input for the month of september, i want to count 1 for my ticket 1025639 and i want to use only the row 10365 which is the first time the ticket came into the grp Grp2.
And if i display my input with a second dimension like the status, i want to count 1 for my ticket 1025639 and status Open (and i don't want to count 1 for the status Resolved).
Thanks.
FG
- Mark as New
- Bookmark
- Subscribe
- Mute
- Subscribe to RSS Feed
- Permalink
- Report Inappropriate Content
Would it be possible to share some sample data, it will be easy to work on?
- Mark as New
- Bookmark
- Subscribe
- Mute
- Subscribe to RSS Feed
- Permalink
- Report Inappropriate Content
Hi,
You will find enclosed my app.
the same expression is used in all the graphs (i want to count tickets in input and output for the month of September).
The result is not the same if i add a dimension, the sum is higher because i count severals time a ticket (1 for each value of the dimension).
What i want to do, is to select in the Set Analysis only one row per ticket (so when i will add new dimension, the sum will be still the same).
Thanks.
Regards
Florent
- Mark as New
- Bookmark
- Subscribe
- Mute
- Subscribe to RSS Feed
- Permalink
- Report Inappropriate Content
Hmmm quite did not get you. Can you show an example like select a group and what values you are expecting to see. And your expressions in Input and Ouput are different. You mentioned they are same.
- Mark as New
- Bookmark
- Subscribe
- Mute
- Subscribe to RSS Feed
- Permalink
- Report Inappropriate Content
Hi Vishwarath,
Choose the group 'FR IT SIAM N2 BACK OFFICE', then you will see that in the global graph, i have :
1981 Tickets in Input
1666 Tickets in output
==> thoses numbers are correct.
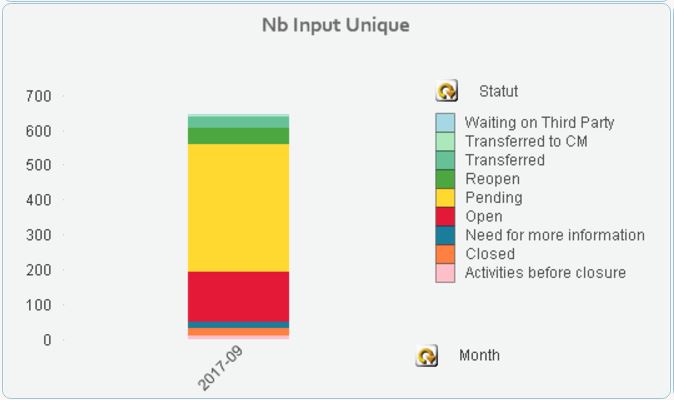
But when you look at the graph 'Details' and choose the dimension 'Phase' per exemple, you will find :
2123 Tickets in Input
1900 tickets in output.
==> those numbers are not correct because it count several times the same tickets but with a different phase.
What i want to do is to select directly in the Set Analysis the last rows for each ticket (regarding the field 'date'), if i can do that my detail graph will be correct.
Thanks for your time and your help.
Note : yes input and output formula are different, but input formula is the same between global graph, detail graph, and detail table.
- Mark as New
- Bookmark
- Subscribe
- Mute
- Subscribe to RSS Feed
- Permalink
- Report Inappropriate Content
I will look into this tomorrow. Sorry was little occupied.
- Mark as New
- Bookmark
- Subscribe
- Mute
- Subscribe to RSS Feed
- Permalink
- Report Inappropriate Content
Thanks.
I don't find any solution 😞