Unlock a world of possibilities! Login now and discover the exclusive benefits awaiting you.
- Qlik Community
- :
- All Forums
- :
- QlikView App Dev
- :
- Re: Sum over aggr
- Subscribe to RSS Feed
- Mark Topic as New
- Mark Topic as Read
- Float this Topic for Current User
- Bookmark
- Subscribe
- Mute
- Printer Friendly Page
- Mark as New
- Bookmark
- Subscribe
- Mute
- Subscribe to RSS Feed
- Permalink
- Report Inappropriate Content
Sum over aggr (in text object)
Dear Community,
i have a straight table with one dimension 'Group' and one expression '=SUM(Aggr(SUM(AMOUNT),GROUP))'
On the top are the totals by expression
The result looks like this :
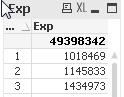
Now i want to display the total 49398... directly inside a text object as a key performance indicator using the same expression
=SUM(Aggr(SUM(AMOUNT),GROUP)). But its not working as the number is not the same comparing with the straight table total
What i am making wrong? Please help
- « Previous Replies
-
- 1
- 2
- Next Replies »
Accepted Solutions
- Mark as New
- Bookmark
- Subscribe
- Mute
- Subscribe to RSS Feed
- Permalink
- Report Inappropriate Content
- Mark as New
- Bookmark
- Subscribe
- Mute
- Subscribe to RSS Feed
- Permalink
- Report Inappropriate Content
Aggr works with the dimensions inside the chart so try to add all the dimensions used in the chart to your aggr statement
- Mark as New
- Bookmark
- Subscribe
- Mute
- Subscribe to RSS Feed
- Permalink
- Report Inappropriate Content
you need to ignore dimension by using total
ex:sum(total column)
- Mark as New
- Bookmark
- Subscribe
- Mute
- Subscribe to RSS Feed
- Permalink
- Report Inappropriate Content
Inside the straight table we have only one dimension called 'Group', so the total value should be the same inside the table and text object
- Mark as New
- Bookmark
- Subscribe
- Mute
- Subscribe to RSS Feed
- Permalink
- Report Inappropriate Content
I tried to use =SUM(Aggr(SUM(Total AMOUNT),GROUP)) but the value was also wrong
- Mark as New
- Bookmark
- Subscribe
- Mute
- Subscribe to RSS Feed
- Permalink
- Report Inappropriate Content
Could you please try with the following expession in the chart and in the text box
'=SUM(Aggr(NODISTINCT SUM(AMOUNT),GROUP))'
- Mark as New
- Bookmark
- Subscribe
- Mute
- Subscribe to RSS Feed
- Permalink
- Report Inappropriate Content
may you please supply a sample QVW ?
- Mark as New
- Bookmark
- Subscribe
- Mute
- Subscribe to RSS Feed
- Permalink
- Report Inappropriate Content
This expression in chart with Group as a dimension
=SUM(Aggr(SUM(AMOUNT),GROUP))
is just an inefficient way of saying
=SUM(AMOUNT)
The first expression is the correct way of expressing the sum and is the equivalent of the chart. If the totals are different, then you are using an expression total rather than a sum of rows, and the equivalent would then be the second expression. Unless you have some restrictions in the chart such as a calculated dimension that filters GROUP.
If that does not resolve the problem, then I suggest you post your qvw or a representative sample to see why it is behaving this way.
- Mark as New
- Bookmark
- Subscribe
- Mute
- Subscribe to RSS Feed
- Permalink
- Report Inappropriate Content
I have prepared an example qvw.file please see attached.
- Mark as New
- Bookmark
- Subscribe
- Mute
- Subscribe to RSS Feed
- Permalink
- Report Inappropriate Content
See attachement below
- « Previous Replies
-
- 1
- 2
- Next Replies »