Unlock a world of possibilities! Login now and discover the exclusive benefits awaiting you.
- Qlik Community
- :
- All Forums
- :
- QlikView App Dev
- :
- Re: Transform Excel
- Subscribe to RSS Feed
- Mark Topic as New
- Mark Topic as Read
- Float this Topic for Current User
- Bookmark
- Subscribe
- Mute
- Printer Friendly Page
- Mark as New
- Bookmark
- Subscribe
- Mute
- Subscribe to RSS Feed
- Permalink
- Report Inappropriate Content
Transform Excel
Hi,
I must have blown a couple of fuses and my brain has gone into hybernation - so some help please...
Client have a LARGE Excel-file - part of it is attached, that I read into a QV app without problem. They have now added a Yearly total (Column Q, Total) that they want to use as data under Version (Column D) - so Version will contain Goal, Result and Total.
Is there a way to do this without rebuilding the Excel-file?
Best regards
Torbjörn Ungvall (@Ungvall)
Senior Business Discovery Manager @ Advectas AB
Accepted Solutions
- Mark as New
- Bookmark
- Subscribe
- Mute
- Subscribe to RSS Feed
- Permalink
- Report Inappropriate Content
Hi,
Then this should work.
DataTmp:
LOAD År,
Segment,
Product,
Version,
Jan,
Feb,
Mar,
Apr,
Maj,
Jun,
Jul,
Aug,
Sep,
Okt,
Nov,
Dec
FROM
[Uppföljning VD-brev indata.xlsx]
(ooxml, embedded labels, table is [Att fylla i]);
JOIN (DataTmp) LOAD DISTINCT År,
Segment,
Product,
'Total' AS Version,
Total AS Dec
FROM
[Uppföljning VD-brev indata.xlsx]
(ooxml, embedded labels, table is [Att fylla i]);
Hope that helps.
Miguel
- Mark as New
- Bookmark
- Subscribe
- Mute
- Subscribe to RSS Feed
- Permalink
- Report Inappropriate Content
Hi Torbjörn,
Do you mean something like this? I'm not sure, though, because I guess you are doing some CROSSTABLE load at some point:
DataTmp:
LOAD År,
Segment,
Product,
Version,
Jan,
Feb,
Mar,
Apr,
Maj,
Jun,
Jul,
Aug,
Sep,
Okt,
Nov,
Dec
FROM
[Uppföljning VD-brev indata.xlsx]
(ooxml, embedded labels, table is [Att fylla i]);
CONCATENATE (DataTmp) LOAD År,
Segment,
Product,
Total AS Version
FROM
[Uppföljning VD-brev indata.xlsx]
(ooxml, embedded labels, table is [Att fylla i]);
Hope that helps someway.
Miguel
- Mark as New
- Bookmark
- Subscribe
- Mute
- Subscribe to RSS Feed
- Permalink
- Report Inappropriate Content
Hi,
If do like that I get Version with Goal, Result and all data from Total. They need to use Version as legend in a bar chart...
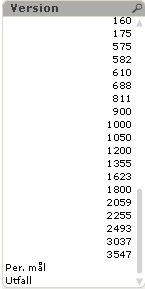
[Note - last two is Goal and Result]
Best regards
Torbjörn Ungvall (@Ungvall)
Senior Business Discovery Manager @ Advectas AB
- Mark as New
- Bookmark
- Subscribe
- Mute
- Subscribe to RSS Feed
- Permalink
- Report Inappropriate Content
Hi,
How is this Total divided? I mean, once you have, according to the excel file you uploaded, Total label below Goal and Result, where does its value have to go? Under January? Or in a new row?
Regards.
Miguel
- Mark as New
- Bookmark
- Subscribe
- Mute
- Subscribe to RSS Feed
- Permalink
- Report Inappropriate Content
Hi,
As the value for Version (Goal) is aggregated, Total is the same value as December (Month) - so it's either that or a new row...
Best regards
Torbjörn Ungvall (@Ungvall)
Senior Business Discovery Manager @ Advectas AB
- Mark as New
- Bookmark
- Subscribe
- Mute
- Subscribe to RSS Feed
- Permalink
- Report Inappropriate Content
Hi,
Then this should work.
DataTmp:
LOAD År,
Segment,
Product,
Version,
Jan,
Feb,
Mar,
Apr,
Maj,
Jun,
Jul,
Aug,
Sep,
Okt,
Nov,
Dec
FROM
[Uppföljning VD-brev indata.xlsx]
(ooxml, embedded labels, table is [Att fylla i]);
JOIN (DataTmp) LOAD DISTINCT År,
Segment,
Product,
'Total' AS Version,
Total AS Dec
FROM
[Uppföljning VD-brev indata.xlsx]
(ooxml, embedded labels, table is [Att fylla i]);
Hope that helps.
Miguel
- Mark as New
- Bookmark
- Subscribe
- Mute
- Subscribe to RSS Feed
- Permalink
- Report Inappropriate Content
Thank you so much - you're a tresure!
Best regards
Torbjörn Ungvall (@Ungvall)
Senior Business Discovery Manager @ Advectas AB
- Mark as New
- Bookmark
- Subscribe
- Mute
- Subscribe to RSS Feed
- Permalink
- Report Inappropriate Content
Hi again,
I didn't get the result I wanted with the original Excel-file, so I'm starting a new thread here: http://community.qlik.com/thread/55651
(With part of original file and script attached...)
Best regards
Torbjörn Ungvall (@Ungvall)
Senior Business Discovery Manager @ Advectas AB