Unlock a world of possibilities! Login now and discover the exclusive benefits awaiting you.
- Qlik Community
- :
- All Forums
- :
- QlikView App Dev
- :
- Using dimensions in script
- Subscribe to RSS Feed
- Mark Topic as New
- Mark Topic as Read
- Float this Topic for Current User
- Bookmark
- Subscribe
- Mute
- Printer Friendly Page
- Mark as New
- Bookmark
- Subscribe
- Mute
- Subscribe to RSS Feed
- Permalink
- Report Inappropriate Content
Using dimensions in script
Hi,
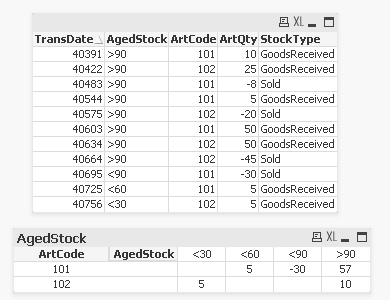
I have list of stock transactions (table is below) and I'm trying to get Aged Stock report that would show me how many items from different period I have in my stock.
When I create Pivot table to see item statuses I get table below. Now I should continue to get the table correct as item 101 result -30 for group <90 should belong to >90 instead. Is there option to get values presented in table to script already, so that I could use if statements when >90 is higher than zero, then sold units should be grouped to >90 instead.
I believe it is not so difficult and I'm only making it more difficult to myself.
Any easier ideas and solutions?
Thanks in advance!
- Mark as New
- Bookmark
- Subscribe
- Mute
- Subscribe to RSS Feed
- Permalink
- Report Inappropriate Content
Sorry, I don't understand what you're trying to do, can you post a sample application?
- Mark as New
- Bookmark
- Subscribe
- Mute
- Subscribe to RSS Feed
- Permalink
- Report Inappropriate Content
Hi, I attached the file where I tried it.
When items are sold then at first the oldest items are sold (>90). When items from last column are sold, then next period should be decresed.
So in my example for item 101 results should be:
| ArtCode | <30 | <60 | <90 | >90 |
|---|---|---|---|---|
| 101 | 0 | 5 | 0 | 27 |
>90; <90; <60 etc- these are calculated depending on transaction date and todays date to see the stock situation at current time point and how long have different items been in the stock already.
I hope it explains it a bit better.