Unlock a world of possibilities! Login now and discover the exclusive benefits awaiting you.
- Qlik Community
- :
- All Forums
- :
- QlikView App Dev
- :
- Yesterday Value
- Subscribe to RSS Feed
- Mark Topic as New
- Mark Topic as Read
- Float this Topic for Current User
- Bookmark
- Subscribe
- Mute
- Printer Friendly Page
- Mark as New
- Bookmark
- Subscribe
- Mute
- Subscribe to RSS Feed
- Permalink
- Report Inappropriate Content
Yesterday Value
Hi,
I am a beginner in QlikView.
I made a Chart table, of which one of the Dimension is Day/Month/Year.
My expression is SUM (FieldName)
I have also some time (last week,month,year and set) list box from which I select the relevant period.
My result is a table with Date and the relative Sum value
My problem -I wish to have another column (expression) which show the value of the day before (I know that yesterday =today -1 BUT I am not using this in my chart.
My wish full result should be
Date Sum Yesterday's Sum
05/08/2015 10 7
05/08/2015 15 10
05/08/2015 17 15
05/08/2015 27 17
Any suggestions will be appreciated
Nir
- Tags:
- qlikview_scripting
Accepted Solutions
- Mark as New
- Bookmark
- Subscribe
- Mute
- Subscribe to RSS Feed
- Permalink
- Report Inappropriate Content
Hi,
You need to try Above([Expression Name]) OR Above(Expression) for this. Hope this helps you.
Regards,
Jagan.
- Mark as New
- Bookmark
- Subscribe
- Mute
- Subscribe to RSS Feed
- Permalink
- Report Inappropriate Content
Is this SUM from yesterday or from line above?
Your Date field has only one value, how did you get 7 for first line of yesterday's SUM?
Check this doc
Missing Manual - Above() and Below()
If you are looking for value from previous row
Feeling Qlikngry?
- Mark as New
- Bookmark
- Subscribe
- Mute
- Subscribe to RSS Feed
- Permalink
- Report Inappropriate Content
There are a few different approaches to take here.
The easiest solution is using the above() function, which will always return the value from the chart line above the current line. Keep in mind that the first line in your chart will always show NULL as the above() value. This solution can only work in a chart by Date, of course.
A more generic solution involves building a special table in your dataset. We usually call it the "As of Date" table. In this table, we associate the "display" date with the "transaction" date and assign a number of conditional flags, for example "Current Date" flag and the "Previous Date" flag. Your can find plenty of documents describing how to use the "As of Date" table, including my blog.
I also described it in great detail in my book "QlikView Your Business".
Cheers,
Oleg Troyansky
- Mark as New
- Bookmark
- Subscribe
- Mute
- Subscribe to RSS Feed
- Permalink
- Report Inappropriate Content
Hi,
You need to try Above([Expression Name]) OR Above(Expression) for this. Hope this helps you.
Regards,
Jagan.
- Mark as New
- Bookmark
- Subscribe
- Mute
- Subscribe to RSS Feed
- Permalink
- Report Inappropriate Content
Hello,
The sum column = quantity which arrives, each day for each container (we have many , of which I present by place, by type of material inside and so on) . This table chart show the sum by container , and aggregated by let Factory >> Factory Group >> Geographic Area. But this I have managed to do in the chart.
Surly the first day, from which we started to collect data will have no yesterday info value.
The 7 was just an example from the previous day, but maybe I was not clear enough.
The idea in total is , once I have the correct expression from the day before I can show in the yesterday column the GAP (today-yesterday) - that is my final goal.
Your help will be appreciated.
Nir
- Mark as New
- Bookmark
- Subscribe
- Mute
- Subscribe to RSS Feed
- Permalink
- Report Inappropriate Content
Could you provide a sample of real data?
- Mark as New
- Bookmark
- Subscribe
- Mute
- Subscribe to RSS Feed
- Permalink
- Report Inappropriate Content
Hello,
Sorry for the late response BUT i have managed to bring en example:
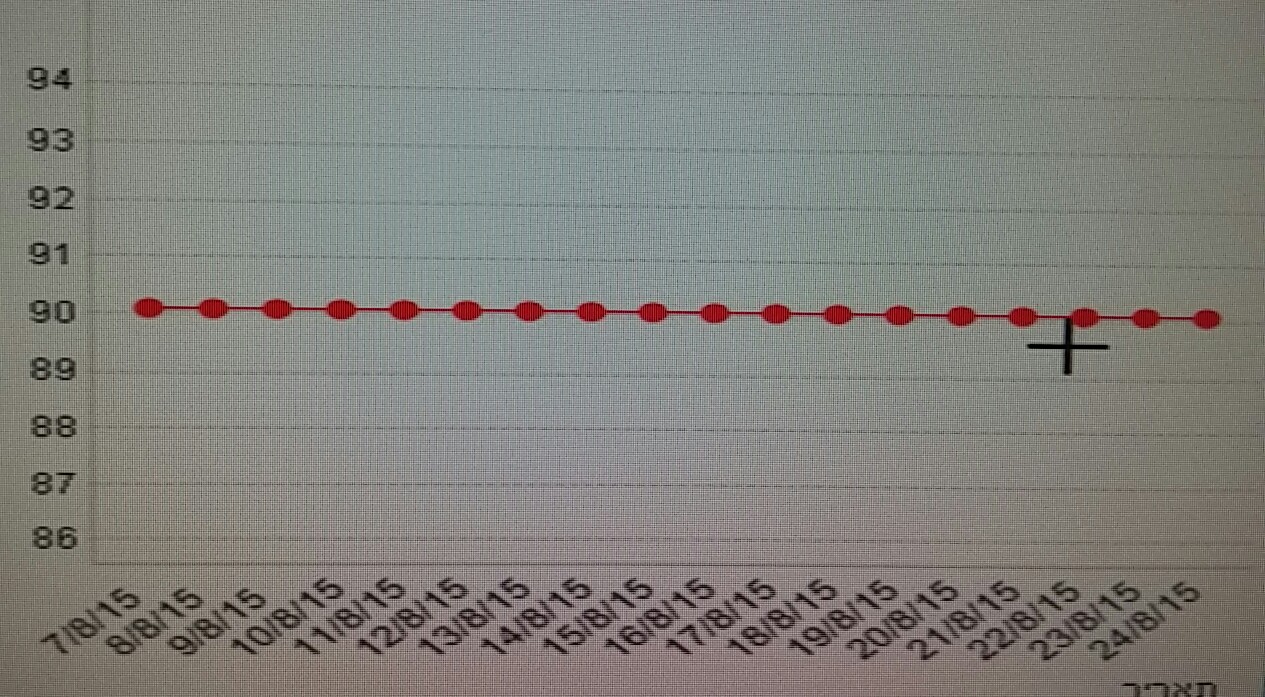
Attached is a photo in which maybe my problem will be clear:
In this photo you can see that all the point are spread near one SINGLE Y-Axis greed line.
I would have expect the greed line to automatically changed, In this zoom-in example, to a range between 89-91 and with jump of 1/3 or 1/2 or something similar so the user can see the little differences between the values.
AGAIN, I would have not expect the range to be smaller if one of the points was out of range.
I would appreciate your input in this issue.
Nir