Unlock a world of possibilities! Login now and discover the exclusive benefits awaiting you.
- Qlik Community
- :
- All Forums
- :
- QlikView App Dev
- :
- automatically restructure excel database
- Subscribe to RSS Feed
- Mark Topic as New
- Mark Topic as Read
- Float this Topic for Current User
- Bookmark
- Subscribe
- Mute
- Printer Friendly Page
- Mark as New
- Bookmark
- Subscribe
- Mute
- Subscribe to RSS Feed
- Permalink
- Report Inappropriate Content
automatically restructure excel database
Hi all,
today's challenge.
I have inherited an excel database. approximate 18000 lines. about 250 columns. Approximate 200 columns contain numeric data, approx 50 columns that could be used as dimensions. Since reporting is coming in monthly, in this format from multiple places I can not change easily the set up of the file overnight.
table below shows some typical headings. No date column is included. For each month for each topic separate columns are created: OI budget, OI intake actual, OI Forecast, Backlog, Revenu budget, revenu realized,, revenu forecast I, etc
| Country | Order Intake Budget January 2017 (EUR) | Order Intake Budget February 2017 (EUR) | Order Intake Actuals September 2016 (EUR) |
| A | 6.844.467 | 7.458.322 | 8.709.211 |
| B | 108.363 | 110.760 | 280.900 |
| C | 25.000 | 25.011 | 145.223 |
| D | 216.503 | 224.783 | 279.774 |
| E | 647.678 | 657.647 | 1.016.776 |
My idea is to use QV to clean up this file.
Would it be possible to for example have qlikview based on the heading:
- combine all "order intake budget xxxxxx" into 1 column
- create an extra date column which is filled with a date (Always 1st day of the month)
Result:
| Country | Date | Order Intake Budget January 2017 (EUR) |
| A | 1-1-2017 | 6.844.467 |
| B | 1-1-2017 | 108.363 |
| C | 1-1-2017 | 25.000 |
| D | 1-1-2017 | 216.503 |
| E | 1-1-2017 | 647.678 |
| A | 1-2-2017 | 7.458.322 |
| B | 1-2-2017 | 110.760 |
| C | 1-2-2017 | 25.011 |
| D | 1-2-2017 | 224.783 |
| E | 1-2-2017 | 657.647 |
thanks for your input
Accepted Solutions
- Mark as New
- Bookmark
- Subscribe
- Mute
- Subscribe to RSS Feed
- Permalink
- Report Inappropriate Content
Hi,
one solution might be:
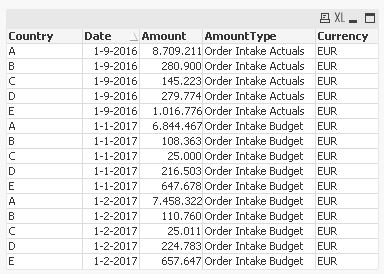
table1:
CrossTable (AmountHeader, Amount)
LOAD * FROM [https://community.qlik.com/thread/252811] (html, codepage is 1252, embedded labels, table is @1);

Join
LOAD Distinct
    AmountHeader,
    Left(AmountHeader,Index(AmountHeader,' ',-3)-1) as AmountType,
    Date(Date#(Mid(AmountHeader,Index(AmountHeader,' ',-3)+1,Index(AmountHeader,' ',-1)-Index(AmountHeader,' ',-3)-1),'MMMM YYYY'),'D-M-YYYY') as Date,
    TextBetween(AmountHeader,'(',')') as Currency
Resident table1;
hope this helps
regards
Marco
- Mark as New
- Bookmark
- Subscribe
- Mute
- Subscribe to RSS Feed
- Permalink
- Report Inappropriate Content
Hi,
one solution might be:
table1:
CrossTable (AmountHeader, Amount)
LOAD * FROM [https://community.qlik.com/thread/252811] (html, codepage is 1252, embedded labels, table is @1);

Join
LOAD Distinct
    AmountHeader,
    Left(AmountHeader,Index(AmountHeader,' ',-3)-1) as AmountType,
    Date(Date#(Mid(AmountHeader,Index(AmountHeader,' ',-3)+1,Index(AmountHeader,' ',-1)-Index(AmountHeader,' ',-3)-1),'MMMM YYYY'),'D-M-YYYY') as Date,
    TextBetween(AmountHeader,'(',')') as Currency
Resident table1;
hope this helps
regards
Marco
- Mark as New
- Bookmark
- Subscribe
- Mute
- Subscribe to RSS Feed
- Permalink
- Report Inappropriate Content
Great Marco!
That did the trick
thank you
mfg
Hans