Unlock a world of possibilities! Login now and discover the exclusive benefits awaiting you.
- Qlik Community
- :
- All Forums
- :
- QlikView App Dev
- :
- Re: get Value of a aggregated Value and subtract t...
- Subscribe to RSS Feed
- Mark Topic as New
- Mark Topic as Read
- Float this Topic for Current User
- Bookmark
- Subscribe
- Mute
- Printer Friendly Page
- Mark as New
- Bookmark
- Subscribe
- Mute
- Subscribe to RSS Feed
- Permalink
- Report Inappropriate Content
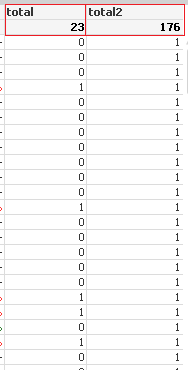
get Value of a aggregated Value and subtract them and Display them
Hey guys im new to qlikview so pleas help me.
How do i get the aggregated value of total and total2 out of this diagramm and then subtract it and display it in a textbox?
- Tags:
- qlikview_scripting
Accepted Solutions
- Mark as New
- Bookmark
- Subscribe
- Mute
- Subscribe to RSS Feed
- Permalink
- Report Inappropriate Content
Hi,
To remove the aggregated total from the chart, Choose "No Total" radio button in Expression tab as below,
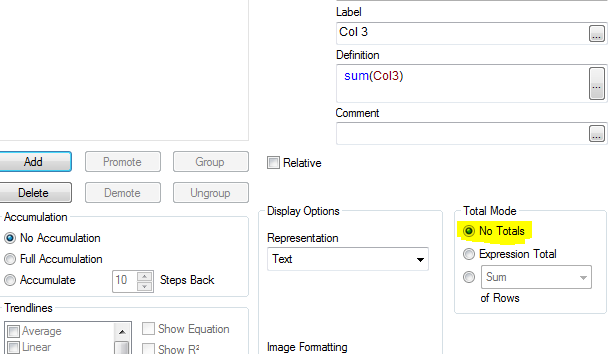
and to show the difference between total & total2 in text box use as below,
=Sum(total)-Sum(total2)
- Mark as New
- Bookmark
- Subscribe
- Mute
- Subscribe to RSS Feed
- Permalink
- Report Inappropriate Content
=Rangesum(Sum(total2), -sum(total))
talk is cheap, supply exceeds demand
- Mark as New
- Bookmark
- Subscribe
- Mute
- Subscribe to RSS Feed
- Permalink
- Report Inappropriate Content
Try this one in text box:-
=sum(TOTAL (total)) - sum(TOTAL (total2))
- Mark as New
- Bookmark
- Subscribe
- Mute
- Subscribe to RSS Feed
- Permalink
- Report Inappropriate Content
With your Solution qlikview doesn't recognize "total", how can i make him recognize that field?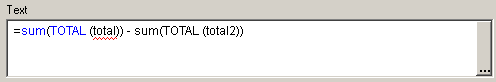
- Mark as New
- Bookmark
- Subscribe
- Mute
- Subscribe to RSS Feed
- Permalink
- Report Inappropriate Content
With your Solution qlikview doesn't recognize "total2", how can i make him recognize that field?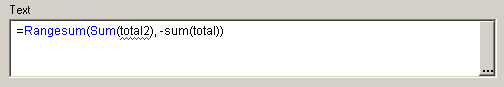
- Mark as New
- Bookmark
- Subscribe
- Mute
- Subscribe to RSS Feed
- Permalink
- Report Inappropriate Content
Hi,
To remove the aggregated total from the chart, Choose "No Total" radio button in Expression tab as below,
and to show the difference between total & total2 in text box use as below,
=Sum(total)-Sum(total2)
- Mark as New
- Bookmark
- Subscribe
- Mute
- Subscribe to RSS Feed
- Permalink
- Report Inappropriate Content
Hi,
Try like this
=Rangesum(Sum(total2Expression) - Sum(totalExpression)
Hope this helps you.
Regards,
Jagan.
- Mark as New
- Bookmark
- Subscribe
- Mute
- Subscribe to RSS Feed
- Permalink
- Report Inappropriate Content
I have a problem with your solution.
Qlikview doesn't recognize the fields that i want to sum.
I tried to change the names of my colums but that also didn't help.

How can i make him recoginze these?
- Mark as New
- Bookmark
- Subscribe
- Mute
- Subscribe to RSS Feed
- Permalink
- Report Inappropriate Content
Use the correct case sensitive field names or the label names of other expressions. Use the same case sensitive names. To Qlikview Sales, SALES, sales and SaLes are four different fields.
talk is cheap, supply exceeds demand
- Mark as New
- Bookmark
- Subscribe
- Mute
- Subscribe to RSS Feed
- Permalink
- Report Inappropriate Content
Hi,
Please use the expression you have used in the chart for columns a & b and not the column name a,b.
Example,

In the above screenshot I have used Sum(Col3) for Col3 and Sum(Col5) for Col5, so to find the difference between Col3 and Col5 we need to calculate as Sum(Col3)-Sum(Col5)