Unlock a world of possibilities! Login now and discover the exclusive benefits awaiting you.
- Qlik Community
- :
- All Forums
- :
- QlikView App Dev
- :
- Re: is possible return 2 expression in one if cond...
- Subscribe to RSS Feed
- Mark Topic as New
- Mark Topic as Read
- Float this Topic for Current User
- Bookmark
- Subscribe
- Mute
- Printer Friendly Page
- Mark as New
- Bookmark
- Subscribe
- Mute
- Subscribe to RSS Feed
- Permalink
- Report Inappropriate Content
is possible return 2 expression in one if condition?
I need to return 2 expression in one if condition.
i.e
if(vVariable = 'Yes', Only(A) and Only(B), if(vVariable='No', Only(C) and Only(D)))
A and B or C and D will be show like a bar in the same chart.
Thanks for replay
Pasquale
- Tags:
- qlikview_scripting
- Mark as New
- Bookmark
- Subscribe
- Mute
- Subscribe to RSS Feed
- Permalink
- Report Inappropriate Content
thanks for the reply. but can't works for me because it show in the legend all expression even if is not used in a chart. I thought about this but I need a find another way ..
Really thanks
- Mark as New
- Bookmark
- Subscribe
- Mute
- Subscribe to RSS Feed
- Permalink
- Report Inappropriate Content
Hi Max,
Yes I want concatenate two expression.
I tried this but doesn't work. the chart show me just one expression, that is a strange number (I don't know which kind of operation the tool do). I would like to show separate bar one for A and another for B.
- Mark as New
- Bookmark
- Subscribe
- Mute
- Subscribe to RSS Feed
- Permalink
- Report Inappropriate Content
Try like:
If (myVariable=1, RangeSum(Only(A), Sum(B)), if(myVariable=2, RangeSum(Only(C), Only (D)), Sum(E)))
- Mark as New
- Bookmark
- Subscribe
- Mute
- Subscribe to RSS Feed
- Permalink
- Report Inappropriate Content
Hi ,
thanks for help me, but dosn' t work yet.
this is the result, I have just one bar (I would like separare bar), where the value is a strange number.
What u thinking about? Maybe you know a different way to do this?
Really thanks
- Mark as New
- Bookmark
- Subscribe
- Mute
- Subscribe to RSS Feed
- Permalink
- Report Inappropriate Content
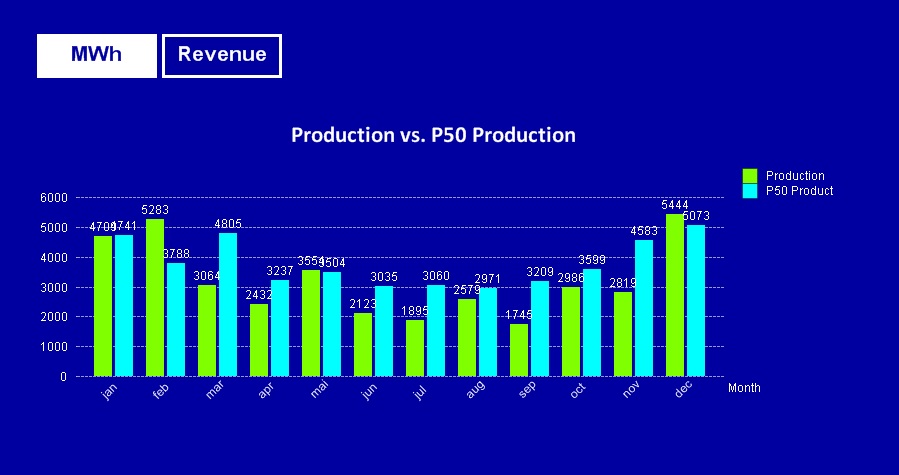
If you want two bars, you'll need two expressions. If they are interchangeable, just have one be Only(A) or Only(C) and the other be Only(B) or Only(D) - that way you'll have two bars, either A and B or C and D.
- Mark as New
- Bookmark
- Subscribe
- Mute
- Subscribe to RSS Feed
- Permalink
- Report Inappropriate Content
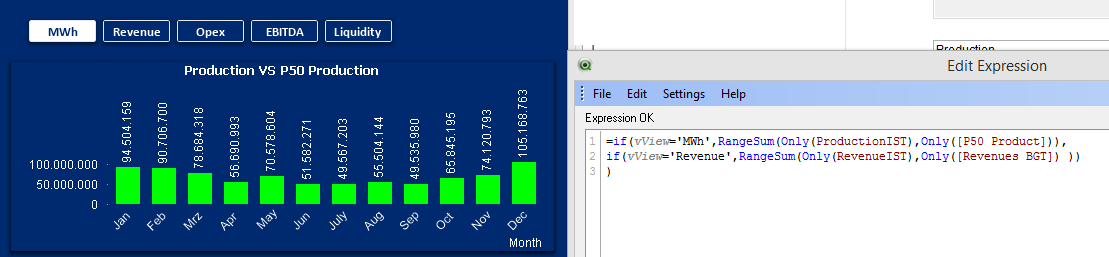
Something like this? I only made it with two buttons. The others follow a similar logic, but you didn't specify what should be displayed when clicking for example 'Opex'.
- Mark as New
- Bookmark
- Subscribe
- Mute
- Subscribe to RSS Feed
- Permalink
- Report Inappropriate Content
Hi Peter,
but you used two different chart or just one? Regarding Opex I have other data but if I can do it for MWh and Revenue, I will do the same for other botton.
- Mark as New
- Bookmark
- Subscribe
- Mute
- Subscribe to RSS Feed
- Permalink
- Report Inappropriate Content
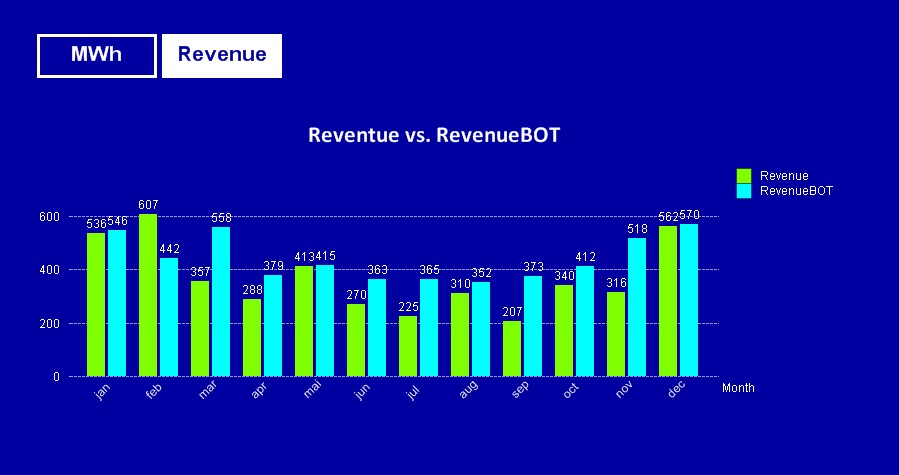
No, this is one chart that dynamically changes almost everything when you press a different button at the top.
Indeed, the addition with other amounts will follow the same logic.
If you're not using a PE Desktop, you can use the document in attachment to figure out how these screenshots were made.
Best,
Peter
- Mark as New
- Bookmark
- Subscribe
- Mute
- Subscribe to RSS Feed
- Permalink
- Report Inappropriate Content
It is just what I need. But I can't see the attach document. where is it? 
- Mark as New
- Bookmark
- Subscribe
- Mute
- Subscribe to RSS Feed
- Permalink
- Report Inappropriate Content
don't open this reply in your inbox but open the thread itself.
regards
Marco