Unlock a world of possibilities! Login now and discover the exclusive benefits awaiting you.
- Qlik Community
- :
- All Forums
- :
- QlikView App Dev
- :
- Re: last 4 weeks data in bar graph
- Subscribe to RSS Feed
- Mark Topic as New
- Mark Topic as Read
- Float this Topic for Current User
- Bookmark
- Subscribe
- Mute
- Printer Friendly Page
- Mark as New
- Bookmark
- Subscribe
- Mute
- Subscribe to RSS Feed
- Permalink
- Report Inappropriate Content
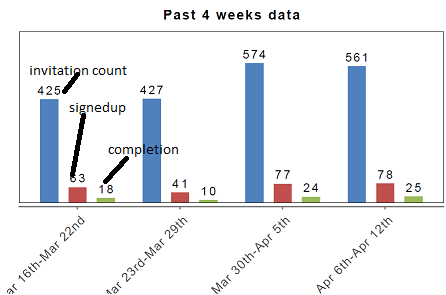
last 4 weeks data in bar graph
Hi all,
I have a data like below. i need the results in bar graph.
invitation_id date_created user_signed course_completed
1 02-04-2015 1 1
2 12-04-2015 1 1
3 20-04-2015 0 0
4 25-04-2015 1 1
5 26-04-2015 1 0
6 27-04-2015 1 1
7 28-04-2015 1 0
8 29-04-2015 1 1
9 01-05-2015 1 1
10 02-05-2015 1 1
11 03-05-2015 1 1
12 03-05-2015 1 0
i am using measures like:
1. count({$<course_completed={1}>}[invitation_id])
2. count({$<user_signed={1}>}[invitation_id])
3. count(invitation_id)
I need bar graph on week basis. last 4 weeks data.
and also for last 7 days. please help me.
Thanks,
Pramod
- Tags:
- qlikview_scripting
- Mark as New
- Bookmark
- Subscribe
- Mute
- Subscribe to RSS Feed
- Permalink
- Report Inappropriate Content
Use Dimension Limits.
Select Show First 4 Values, based on a date field or a range field with an attached date value.
Do not forget to Sort the dimension from Last to First
Peter
- Mark as New
- Bookmark
- Subscribe
- Mute
- Subscribe to RSS Feed
- Permalink
- Report Inappropriate Content
hi peter,
I am not getting. will u please explain it briefly. and how it is used
Pramod
- Mark as New
- Bookmark
- Subscribe
- Mute
- Subscribe to RSS Feed
- Permalink
- Report Inappropriate Content
Well, since you are using week-related dimension values, there should be some underlying date value (like e.g. WeekStart()) Use that value to sort the X-axis from Latest to Earliest. The underlying date value includes a year, so you won't get into trouble with multiple years (like you mentioned in your other discussion on the same topic)
Then add ad dimension limit that limits the number of X-axis values to the first four. Or first seven in case of day values.
- Mark as New
- Bookmark
- Subscribe
- Mute
- Subscribe to RSS Feed
- Permalink
- Report Inappropriate Content
peter i got it. i am asking how can i add that limit. through expression or something else?
- Mark as New
- Bookmark
- Subscribe
- Mute
- Subscribe to RSS Feed
- Permalink
- Report Inappropriate Content
Right-click on your bar chart, select Properties->Dimension Limits
Peter
- Mark as New
- Bookmark
- Subscribe
- Mute
- Subscribe to RSS Feed
- Permalink
- Report Inappropriate Content
are you explaining in qliksense right. i am not getting the "properties".
- Mark as New
- Bookmark
- Subscribe
- Mute
- Subscribe to RSS Feed
- Permalink
- Report Inappropriate Content
This is a QlikView discussion, so I'm explaining what you get in QlikView Desktop.
Peter