Unlock a world of possibilities! Login now and discover the exclusive benefits awaiting you.
- Qlik Community
- :
- All Forums
- :
- QlikView App Dev
- :
- Re: show only the last value in a graphic
- Subscribe to RSS Feed
- Mark Topic as New
- Mark Topic as Read
- Float this Topic for Current User
- Bookmark
- Subscribe
- Mute
- Printer Friendly Page
- Mark as New
- Bookmark
- Subscribe
- Mute
- Subscribe to RSS Feed
- Permalink
- Report Inappropriate Content
show only the last value in a graphic
- Tags:
- qlikview_scripting
- « Previous Replies
-
- 1
- 2
- Next Replies »
Accepted Solutions
- Mark as New
- Bookmark
- Subscribe
- Mute
- Subscribe to RSS Feed
- Permalink
- Report Inappropriate Content
For example, if your dimension is Year and your expression is sum(Sales), you need to set up a second expression that looks like the following:
if(Year=$(=max(Year)), sum(Sales), '')
An example is also attached.

- Mark as New
- Bookmark
- Subscribe
- Mute
- Subscribe to RSS Feed
- Permalink
- Report Inappropriate Content
Hi Ingo,
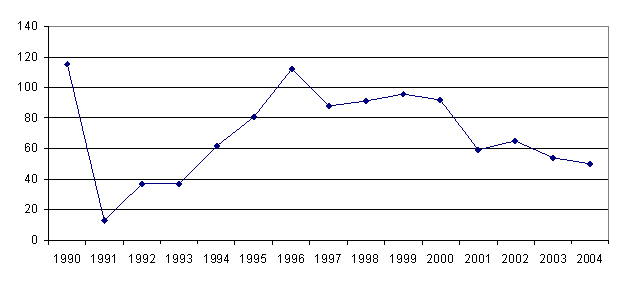
so you want this whole x-axis (1990 to 2004), but only the value for 2004 visible?
How about editing the "background colour" of the chart (formula_properties, click on the "+" sign) to be
- blue for the last dimension value
- white otherwise
HTH
Best regards,
DataNibbler
- Mark as New
- Bookmark
- Subscribe
- Mute
- Subscribe to RSS Feed
- Permalink
- Report Inappropriate Content
For example, if your dimension is Year and your expression is sum(Sales), you need to set up a second expression that looks like the following:
if(Year=$(=max(Year)), sum(Sales), '')
An example is also attached.

- Mark as New
- Bookmark
- Subscribe
- Mute
- Subscribe to RSS Feed
- Permalink
- Report Inappropriate Content
Hey,
thank you for the quick response.
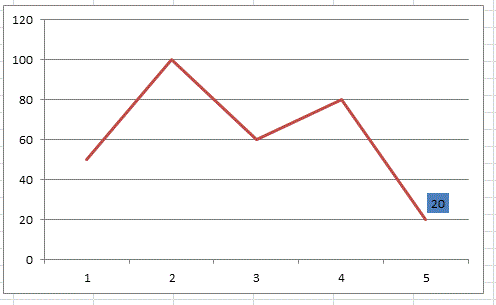
The line should be visible, but only the last value should be shown in the graphic:

- Mark as New
- Bookmark
- Subscribe
- Mute
- Subscribe to RSS Feed
- Permalink
- Report Inappropriate Content
Hey Nicole,
its working....thank you very much for the correct solution.....great!!
Best regards...
- Mark as New
- Bookmark
- Subscribe
- Mute
- Subscribe to RSS Feed
- Permalink
- Report Inappropriate Content
I'm glad it works ![]()
- Mark as New
- Bookmark
- Subscribe
- Mute
- Subscribe to RSS Feed
- Permalink
- Report Inappropriate Content
Hi Nicole,
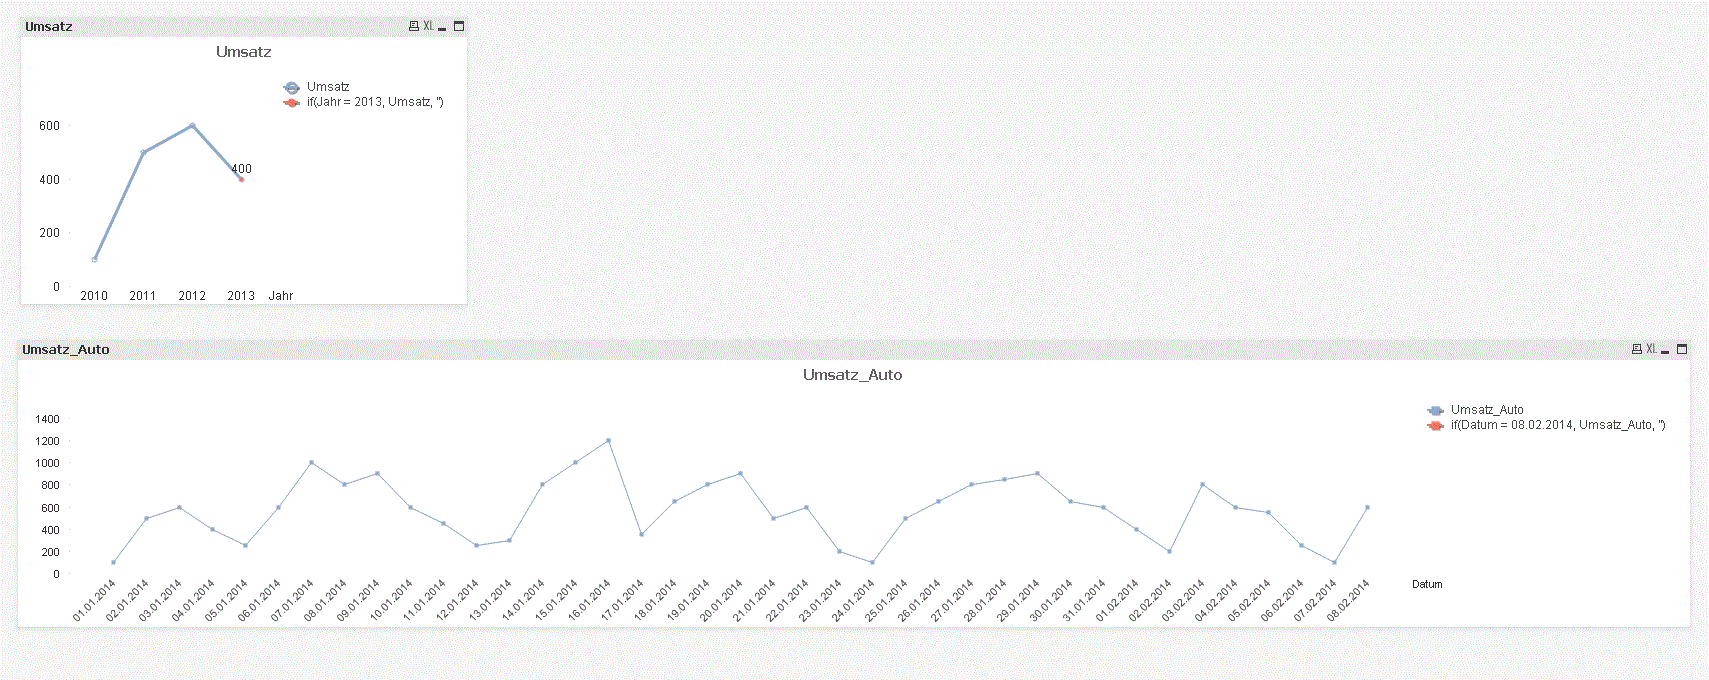
sorry, one more question. In the following case it doesnt work (second Graphic). Do you have any idea? Thank you in advance.
Best regards...

- Mark as New
- Bookmark
- Subscribe
- Mute
- Subscribe to RSS Feed
- Permalink
- Report Inappropriate Content
Hi Ingo,
It is a because of a problem with your Date format.
try this:
if(num(Datum) = $(=num(max(Datum))), Umsatz_Auto, '')
- Mark as New
- Bookmark
- Subscribe
- Mute
- Subscribe to RSS Feed
- Permalink
- Report Inappropriate Content
Hi,
thank you very much . In the above example your solution is working. Do have any idea for the following
one?Is the date Format, the Variable or the group by period the Problem?
- Mark as New
- Bookmark
- Subscribe
- Mute
- Subscribe to RSS Feed
- Permalink
- Report Inappropriate Content
Hi,
I think you'd better change your model to create a separate calendar from your model, like this:
FACT:
LOAD
Anliegen_Nr,
[Vers. Person],
Eingangskanal,
Anliegen_Status,
A_Eröffnungsdatum,
A_Erledigungsdatum,
A_Abschlussdatum,
ANL_versch_Flag,
ANL_versch_Anz,
ANL_erl_min
FROM
C:\Users\p14890\Desktop\test.xls
(biff, embedded labels, table is [Sheet1$]);
CALENDAR:
LOAD DISTINCT
A_Eröffnungsdatum as Date,
Month(Date(A_Eröffnungsdatum)) as Mois,
Year(Date(A_Eröffnungsdatum)) as Annee,
'Q'&Ceil(num(Month(Date(A_Eröffnungsdatum)))/3) as Trimestre
RESIDENT
FACT:
;
Then you can work easily on the year, month or date as you want.
- « Previous Replies
-
- 1
- 2
- Next Replies »
