Unlock a world of possibilities! Login now and discover the exclusive benefits awaiting you.
- Qlik Community
- :
- All Forums
- :
- QlikView Administration
- :
- Re: Qlikview RAM usage
- Subscribe to RSS Feed
- Mark Topic as New
- Mark Topic as Read
- Float this Topic for Current User
- Bookmark
- Subscribe
- Mute
- Printer Friendly Page
- Mark as New
- Bookmark
- Subscribe
- Mute
- Subscribe to RSS Feed
- Permalink
- Report Inappropriate Content
Qlikview RAM usage
Hi all,
I need your help to understand the governance dashboard and how I can get some conclusions about the information displayed.
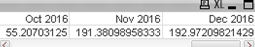
The following table shows the VMCommitted_MB_ average per month for a document. We can see a big increment of RAM size from October to November without explanation. The file wasn't changed and the amount of data wasn't changed.
I have checked the following fields: QVWTableNbrRows and Size. Both fields keep the same average of information.
So I have some questions to continue to drill down the information and figure out what is the root cause of this:
- What can impact the VMCommitted_MB_? Amount of users? Amount of sessions? Amount of selections? If yes, how can I drill down to this?
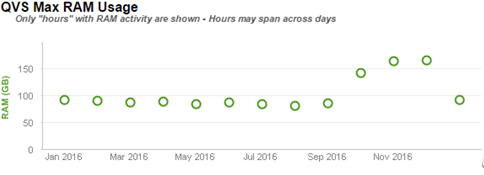
- My main goal is to figure out why the RAM usage is increasing so much in the last months? As you can see in the following picture.
Thank you all for your support.
- « Previous Replies
-
- 1
- 2
- Next Replies »
- Mark as New
- Bookmark
- Subscribe
- Mute
- Subscribe to RSS Feed
- Permalink
- Report Inappropriate Content
What version of GovDB are you using?
(There was an issue with 2.0 in which some data - like server performance - could get doubled inside the app if the reload frequency of the GovDB was higher (more often) than the server logs were being rolled over.)
- Mark as New
- Bookmark
- Subscribe
- Mute
- Subscribe to RSS Feed
- Permalink
- Report Inappropriate Content
Hi Tyler,
Thanks a lot for your answer.
The version that I'm using is 1.1.1.
Best regards
- Mark as New
- Bookmark
- Subscribe
- Mute
- Subscribe to RSS Feed
- Permalink
- Report Inappropriate Content
Hello Joao,
I believe you're correct in that the number of users/open sessions can affect the memory usage, since each user has to hit the server to initially load the dashboards.
Are you using Publisher to push your dashboards to the users?
Developing on the same server that is feeding Accesspoint will also affect memory usage.
- Mark as New
- Bookmark
- Subscribe
- Mute
- Subscribe to RSS Feed
- Permalink
- Report Inappropriate Content
Hi David, thanks a lot for your answer.
Yes, I'm using the publisher. I have separated environments DEV and PRD.
Regarding the users and sessions, I drilled down the information in Governance Dashboard and I found contradictory information in the following table. Probably I'm understanding it wrong...
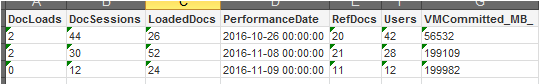
In this table, it seems the users / docs / sessions don't impact the RAM usage, so I'm a little bit lost, and I don't understand why in the last months the RAM increased so much...
Thanks in advance
- Mark as New
- Bookmark
- Subscribe
- Mute
- Subscribe to RSS Feed
- Permalink
- Report Inappropriate Content
Hello Joao,
This webinar QlikView Memory Management will help you understand how QlikView utilizes memory and also how to troubleshoot.
Hope this helps
-Chip
Help users find answers! Don't forget to mark a solution that worked for you!
- Mark as New
- Bookmark
- Subscribe
- Mute
- Subscribe to RSS Feed
- Permalink
- Report Inappropriate Content
Oi João!
I am glad you are trying to dig in using the Governance Dashboard.
Here's a little info on the QV Server performance logs:
- Each five minutes (or whatever interval you set in QMC) various performance counters are taken, including:
ActiveDocs, ActiveDocSessions, LoadedDocs, VMCommitted_MB_
- You can find information online about these fields: http://help.qlik.com/en-US/qlikview/12.1/Subsystems/QMC/Content/QMC_Status_QVSStatistics_Performance...
- The Governance Dashboard chart shows the MAX VMCommitted_MB_ for any one of these 5-minute performance counters
- The other fields do the same - DocLoads means "Number of new documents loaded during the interval." This is different than LoadedDocs which is the total docs loaded into memory at the end of the interval
- Users -- not sure what that one means in your table, but if it is coming from the performance log, it is just the number of users on when the interval ends. You could have lots of other activity.
- DocSessions is the number of sessions (app+user) at the interval. I'm not sure if that means the total throughout the interval or the total when the interval ended.
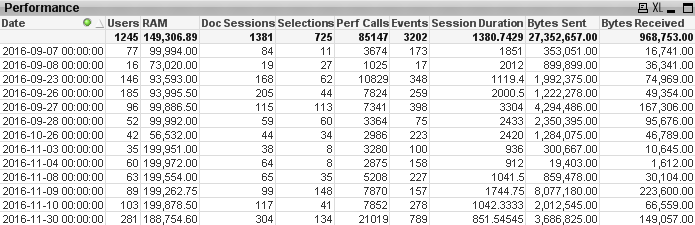
Consider that though the DocSessions is highest in the first line of your table, it does not mean that the apps accessed and how users were interacting with the apps was the most intense. In other words, you might have just one user accessing one specific app on Nov 8 or Nov 9 that is causing the VMCommitted to be so high.
I would use the VMCommitted information along with session data - user and app and selections, etc. - to get a better sense of which users or apps might be resulting in higher RAM usage.
Also, if you have audit logging enabled, you can see that activity as well for those times.
- Mark as New
- Bookmark
- Subscribe
- Mute
- Subscribe to RSS Feed
- Permalink
- Report Inappropriate Content
Hi Tyler and Chip,
Thanks a lot for your answers.
@Chip I cannot open the webinar that you sent. Error message the content is restricted  .
.
@Tyler all the fields that I'm showing are the ones from the Governance Dashboard.
The following table shows all the fields that I think, that are important to this analysis. I still don't have a clue and I cannot find any pattern in the data.
Through this analysis I want to:
1 - Understand that in the end of the year all the users want to do their own year review and they are increasing their own analysis, but I cannot justify it, yet, to the client this increment of RAM usage.
or
2 - Understand if something can be tuned or not...
I didn't have the Audit Log enable. I enable it now, but I guess I will not have history information.
Well I will continue monitoring the server performance in the following days to see if I catch something...
Thanks a lot 
- Mark as New
- Bookmark
- Subscribe
- Mute
- Subscribe to RSS Feed
- Permalink
- Report Inappropriate Content
João,
Yes, the fields are there in the Governance Dashboard, but what measure (expression) are you using? The performance metrics are defaulted to be every 5 minutes but the chart just shows every few days at midnight.
So the question is why the RAM (what is the expression here?) goes from ~100 to ~200 in November?
What do sessions and user counts look like during that time period? (get this information from the Sessions page of the app)
Note that these two measures on the Sessions page are different than the "Users" and "Doc Sessions" on the Performance page.
- Mark as New
- Bookmark
- Subscribe
- Mute
- Subscribe to RSS Feed
- Permalink
- Report Inappropriate Content
The increase is most likely related to caching and how often the service is restarted. QVS will collect cache entries up to the Low WS value until the service is restarted. The first thing I would look at is how often the service is recycled. Did the schedule change?
-Rob
- « Previous Replies
-
- 1
- 2
- Next Replies »