Unlock a world of possibilities! Login now and discover the exclusive benefits awaiting you.
- Qlik Community
- :
- All Forums
- :
- QlikView Administration
- :
- Qlikview RAM usage
- Subscribe to RSS Feed
- Mark Topic as New
- Mark Topic as Read
- Float this Topic for Current User
- Bookmark
- Subscribe
- Mute
- Printer Friendly Page
- Mark as New
- Bookmark
- Subscribe
- Mute
- Subscribe to RSS Feed
- Permalink
- Report Inappropriate Content
Qlikview RAM usage
Hi all,
I need your help to understand the governance dashboard and how I can get some conclusions about the information displayed.
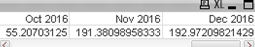
The following table shows the VMCommitted_MB_ average per month for a document. We can see a big increment of RAM size from October to November without explanation. The file wasn't changed and the amount of data wasn't changed.
I have checked the following fields: QVWTableNbrRows and Size. Both fields keep the same average of information.
So I have some questions to continue to drill down the information and figure out what is the root cause of this:
- What can impact the VMCommitted_MB_? Amount of users? Amount of sessions? Amount of selections? If yes, how can I drill down to this?
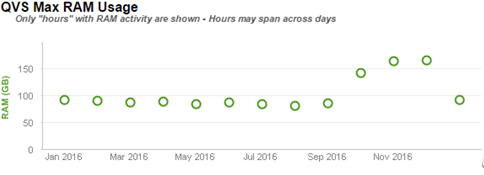
- My main goal is to figure out why the RAM usage is increasing so much in the last months? As you can see in the following picture.
Thank you all for your support.
- « Previous Replies
-
- 1
- 2
- Next Replies »
- Mark as New
- Bookmark
- Subscribe
- Mute
- Subscribe to RSS Feed
- Permalink
- Report Inappropriate Content
Joao,
Try this one on YouTube: https://www.youtube.com/watch?v=aS8FX_TJZd0
-Chip
Help users find answers! Don't forget to mark a solution that worked for you!
- « Previous Replies
-
- 1
- 2
- Next Replies »