Unlock a world of possibilities! Login now and discover the exclusive benefits awaiting you.
- Qlik Community
- :
- All Forums
- :
- QlikView
- :
- Need to get Last year data
- Subscribe to RSS Feed
- Mark Topic as New
- Mark Topic as Read
- Float this Topic for Current User
- Bookmark
- Subscribe
- Mute
- Printer Friendly Page
- Mark as New
- Bookmark
- Subscribe
- Mute
- Subscribe to RSS Feed
- Permalink
- Report Inappropriate Content
Need to get Last year data
Hi All,
I have fields like cat , sales org and date field where i have Years from 2016 Jan to 2017 Dec.
And i have a field called cons where there are values of 2016 jan and 2017 dec.
Now i need to add one more field called Cons_LY where if i select jan 2017 it should show Jan 2016 data and similarly if i select 2017 feb it should show for feb 2017 data..
Can you please help me how can i do it.. Can it be done in script
Attached app for ref.
Thanks,
Bharat
- Mark as New
- Bookmark
- Subscribe
- Mute
- Subscribe to RSS Feed
- Permalink
- Report Inappropriate Content
Then CalendarMonthCode can be also changed to add one year:
Date(AddYears(Calendar_Month_Code, 1), 'YYYYMM') as Calendar_Month_Code
if the data is aggregated a last join can be done to reduce rows and have Consumption and LYConsumption in the same row.
- Mark as New
- Bookmark
- Subscribe
- Mute
- Subscribe to RSS Feed
- Permalink
- Report Inappropriate Content
Thanks a lot Sunny..
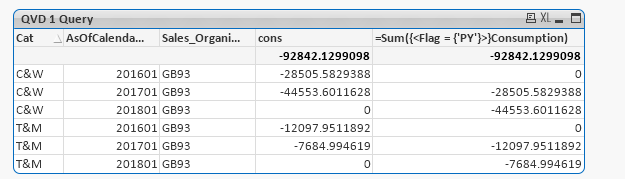
But only one help needed. Is it possible to derive this expression what you have used in chart =Sum({<Flag = {'PY'}>}Consumption)
as a field called Cons_LY in script it-self..
- Mark as New
- Bookmark
- Subscribe
- Mute
- Subscribe to RSS Feed
- Permalink
- Report Inappropriate Content
Do you want to aggregate this in the script also?
- Mark as New
- Bookmark
- Subscribe
- Mute
- Subscribe to RSS Feed
- Permalink
- Report Inappropriate Content
Yes only in script i need to do for current year cons and last year cons and in chart directly i can load only those fields..
- Mark as New
- Bookmark
- Subscribe
- Mute
- Subscribe to RSS Feed
- Permalink
- Report Inappropriate Content
No, what I mean is that you might have multiple rows for each Sales_Organization, Cat and MonthYear.... so when we join... it sort of do a Cartesian join causing the numbers to increase. Can we sum up consumption to show at the level of Sales_Organization, Cat, and MonthYear for This year and last year?
- Mark as New
- Bookmark
- Subscribe
- Mute
- Subscribe to RSS Feed
- Permalink
- Report Inappropriate Content
Yes Sunny, We need to do that one only.
But even i have 4 to 5 years more there won't be any problem right. Because later i will data from 2015 to 2019
Now what ever the solution you have provided is what i needed but instead of writing those two expressions i need to get directly fields because later i will create qvd's..
Please let me know if i explained you correctly
- Mark as New
- Bookmark
- Subscribe
- Mute
- Subscribe to RSS Feed
- Permalink
- Report Inappropriate Content
May be this
T1:
LOAD Sales_Organization,
Cat,
Calendar_Month_Code,
Calendar_Year_Code,
Sum(Consumption) as Consumption
FROM [T1.qvd](qvd)
Where Calendar_Year_Code>='2016'
Group By Sales_Organization, Cat, Calendar_Month_Code, Calendar_Year_Code;
Left Join (T1)
LOAD Sales_Organization,
Cat,
AddYears(Calendar_Month_Code, 1) as Calendar_Month_Code,
Consumption AS Cons_LY
Resident T1;
But notice that your number of rows went down from 10,170 to just 170..... Not sure if that is what you want
- Mark as New
- Bookmark
- Subscribe
- Mute
- Subscribe to RSS Feed
- Permalink
- Report Inappropriate Content
Sorry Sunny to ask you for many times.
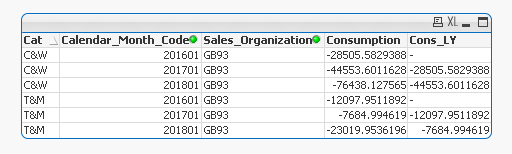
Please find the below image which you have given the solution and this what i needed:
But the set analysis what you have used for getting this year cons and last year cons is it possible to derive those fields in script it-self. Because the left join option what you have given is not working as like the above image.
Is it possible to derive those..
- Mark as New
- Bookmark
- Subscribe
- Mute
- Subscribe to RSS Feed
- Permalink
- Report Inappropriate Content
Thanks Ruben
- Mark as New
- Bookmark
- Subscribe
- Mute
- Subscribe to RSS Feed
- Permalink
- Report Inappropriate Content
What's the difference?