Unlock a world of possibilities! Login now and discover the exclusive benefits awaiting you.

- Qlik Community
- :
- All Forums
- :
- QlikView
- :
- scoll bar on x axis with 2 dimensions
Options
- Subscribe to RSS Feed
- Mark Topic as New
- Mark Topic as Read
- Float this Topic for Current User
- Bookmark
- Subscribe
- Mute
- Printer Friendly Page
Turn on suggestions
Auto-suggest helps you quickly narrow down your search results by suggesting possible matches as you type.
Showing results for

 jose_vargas
Creator
2019-01-09
12:27 PM
- Mark as New
- Bookmark
- Subscribe
- Mute
- Subscribe to RSS Feed
- Permalink
- Report Inappropriate Content
scoll bar on x axis with 2 dimensions
Hello commuity.
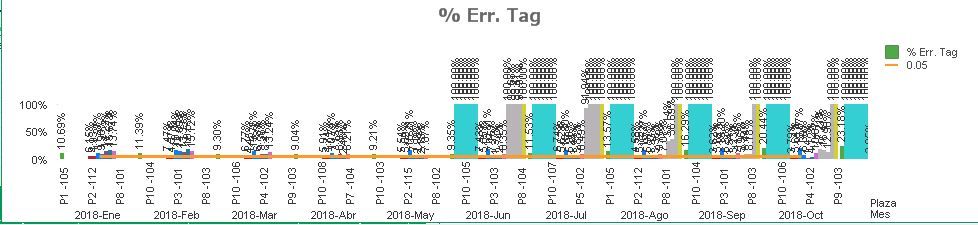
I have the following graph with 2 dimensions, the place and the date are shown, but all the bars are seen together.
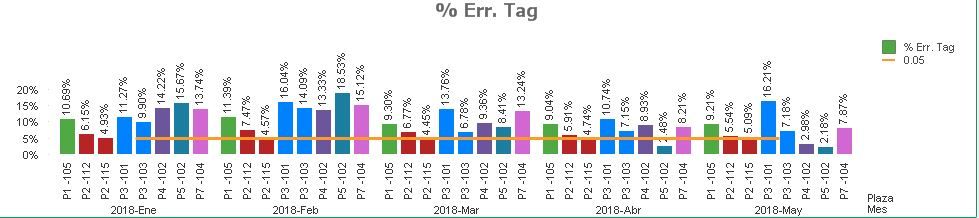
If I filter for 5 months, the graph looks better.
Then, when I enter the properties and activate the scroll bar, limiting it to only showing 5 values (Date), in the graph it no longer shows me the months.
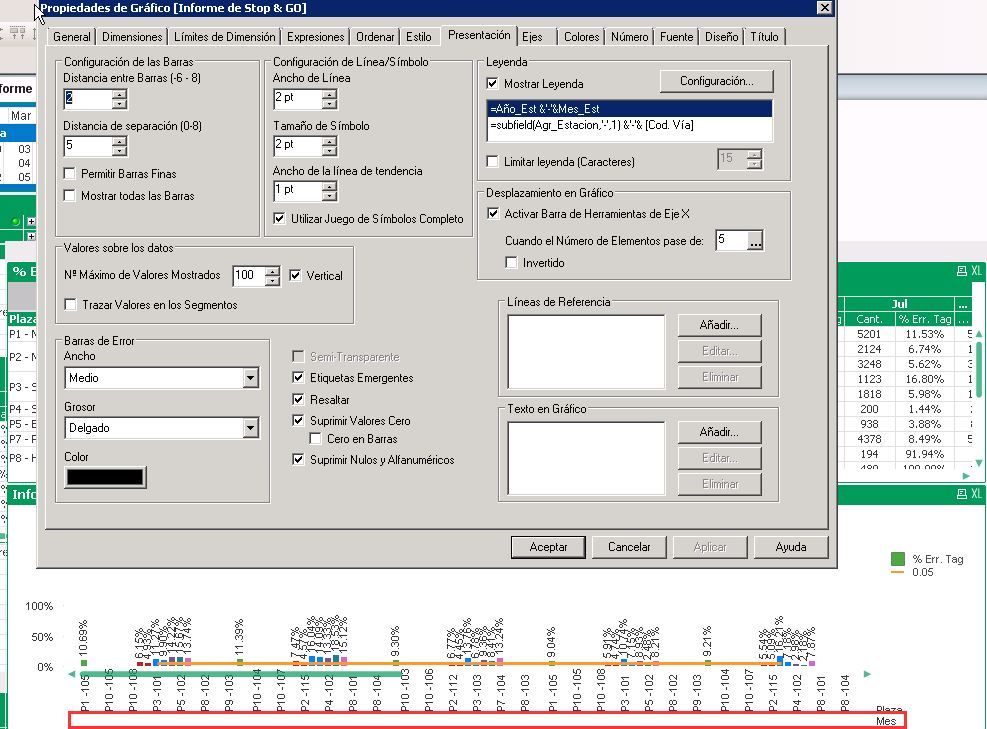
how do I to active the scrollbar for each 5 months?. I hope you understood me.
thanks.,
jose
697 Views
0 Replies
