Unlock a world of possibilities! Login now and discover the exclusive benefits awaiting you.

Announcements
Share your agentic AI experience, learn from others, and earn a new badge: Put Agentic AI to Work
- Qlik Community
- :
- All Forums
- :
- QlikView
- :
- two different year sales in a single bar
Options
- Subscribe to RSS Feed
- Mark Topic as New
- Mark Topic as Read
- Float this Topic for Current User
- Bookmark
- Subscribe
- Mute
- Printer Friendly Page
Turn on suggestions
Auto-suggest helps you quickly narrow down your search results by suggesting possible matches as you type.
Showing results for

Anonymous
Not applicable
2017-11-22
11:41 PM
- Mark as New
- Bookmark
- Subscribe
- Mute
- Subscribe to RSS Feed
- Permalink
- Report Inappropriate Content
two different year sales in a single bar
hello everyone
i need to show two different year sales data in a single bar in a bar chart like below. it shows sales value of April month of year 2016 & 2017. please help me to find out solution.
Thank you.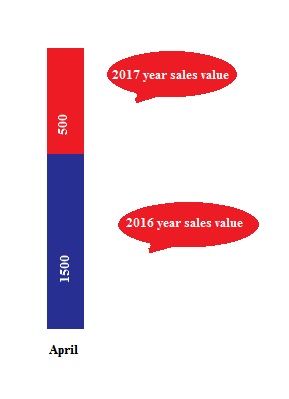
2,636 Views
- « Previous Replies
-
- 1
- 2
- Next Replies »
11 Replies

 woshua5550
Creator III
2017-11-23
03:13 AM
- Mark as New
- Bookmark
- Subscribe
- Mute
- Subscribe to RSS Feed
- Permalink
- Report Inappropriate Content
that's fine , can you solve it now ? if not , what against you ?
385 Views
Anonymous
Not applicable
2017-11-23
03:19 AM
Author
- Mark as New
- Bookmark
- Subscribe
- Mute
- Subscribe to RSS Feed
- Permalink
- Report Inappropriate Content
it is possible to give one more condition like category wise sales
385 Views
- « Previous Replies
-
- 1
- 2
- Next Replies »