Unlock a world of possibilities! Login now and discover the exclusive benefits awaiting you.
- Qlik Community
- :
- All Forums
- :
- Qlik Reporting Service
- :
- Modular Result in a Pivot Table - Calculate the Re...
Options
- Subscribe to RSS Feed
- Mark Topic as New
- Mark Topic as Read
- Float this Topic for Current User
- Bookmark
- Subscribe
- Mute
- Printer Friendly Page
Turn on suggestions
Auto-suggest helps you quickly narrow down your search results by suggesting possible matches as you type.
Showing results for
Contributor
2022-05-02
03:18 AM
- Mark as New
- Bookmark
- Subscribe
- Mute
- Subscribe to RSS Feed
- Permalink
- Report Inappropriate Content
Modular Result in a Pivot Table - Calculate the Result when i 've reached up 85% of a odd variable - Fractile
Hi!
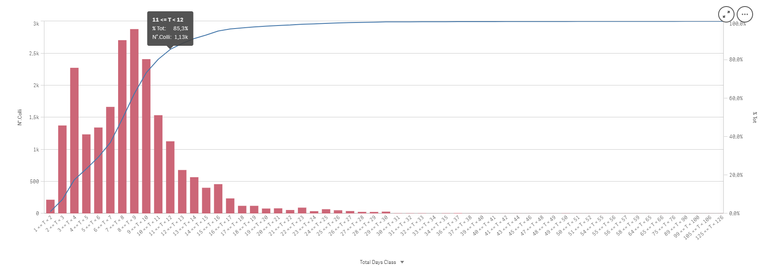
I've made an histogram where I see:
- Numbers of Packages
- Time (Lead Time from Arrived to Shipping)
I need to study the Lead Time when i 've reached up 85% of numer packages ordered by Lead Time Ascendend
(see picture under)
I've to put this result on Pivot Table, where i have categories variables as Area, Store, Region, Package Type, Good Type...
The formula of my goal is:
=Max({< [LeadTime]={"<= $(=fractile([Lead Time],0.85))"} >} [Lead Time])
But if I put it in a Pivot, I ve :
The result is not modular when i change the categories variables, but its always the same!
What shall I write ??
Hoping a solution,
marco
Labels (8)
Labels
0 Replies

