Unlock a world of possibilities! Login now and discover the exclusive benefits awaiting you.
- Qlik Community
- :
- All Forums
- :
- Qlik Reporting Service
- :
- QlikSense App access performance issue
- Subscribe to RSS Feed
- Mark Topic as New
- Mark Topic as Read
- Float this Topic for Current User
- Bookmark
- Subscribe
- Mute
- Printer Friendly Page
- Mark as New
- Bookmark
- Subscribe
- Mute
- Subscribe to RSS Feed
- Permalink
- Report Inappropriate Content
QlikSense App access performance issue
We have an app which is 10 GB of size. Recently we started facing severe performance issue like extreme slowness and timeout issues for end users. I wanted to know if below things affect the performance.
1] App reload is scheduled daily so having simultaneous app reload and app hub access is creating an issue?
2] Considering the size of the application how can we accurately measure its CPU and RAM footprint per user?
3] App cache time is currently 8 hours which is default, do you recommend reducing it to lesser time as RAM will always be occupied if the app is constantly in use.
Accepted Solutions
- Mark as New
- Bookmark
- Subscribe
- Mute
- Subscribe to RSS Feed
- Permalink
- Report Inappropriate Content
I suggest that you start with evaluating performance of your App using the following.
- https://www.youtube.com/watch?v=GbFYZsGXBU4
- https://help.qlik.com/en-US/cloud-services/Subsystems/Hub/Content/Sense_Hub/Apps/app-performance-eva...
You can use the performance evaluation tool to discover detailed information about the performance of your apps and components therein. Once you have done a baseline evaluation, you can then start to compare evaluations for changes in performance against future evaluations.
Once you see the differences in the evaluations, you can see where the performance improved or declined based on changes made.
If you don't have an existing baseline to work from, you will still see performance results of individual app components.
From this, you can then apply the suggestions found here based on the evaluation findings.
- https://help.qlik.com/en-US/cloud-services/Subsystems/Hub/Content/Sense_Hub/Apps/app-performance.htm
Kind regards...
- Mark as New
- Bookmark
- Subscribe
- Mute
- Subscribe to RSS Feed
- Permalink
- Report Inappropriate Content
I suggest you evaluate the app with QSDA Pro. You will get a picture of RAM footprint for the total app and per user, plus identification of performance hot-spots and best practice recommendations.
Use the RAM information to:
- Identify how much RAM could be saved by dropping unused fields. Use the Drop Fields tool to generate a Drop fields statement for unused fields.
- Identify used fields that occupy lots of RAM and perhaps could be stored more efficiently.
-Use the Viz Calculation timings to identify what charts are taking the longest to calculate and where -- what measure or expression - the time is consumed.
-Use the Performance flags to call out practices that may negatively affect app performance.
Video: Using QSDA Pro
The Qlik App Performance Evaluator is useful as well, but it is currently available only in SaaS. QSDA Pro can evaluate apps in both SaaS and on-prem Qlik.
-Rob
- Mark as New
- Bookmark
- Subscribe
- Mute
- Subscribe to RSS Feed
- Permalink
- Report Inappropriate Content
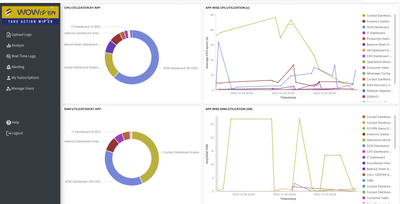
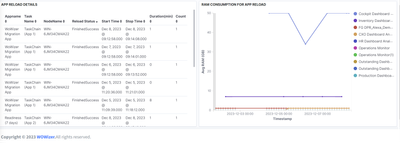
WoWizer TPM will help you in analyzing.
1. App wise RAM & CPU trend in Realtime
2. During App Reload RAM Consumption
You can check out WoWizer TPM product for free trial , Below is the link for the same.
Let me know in case you need any help for this! Happy to Help...
Regards,
Nirav Bhimani

