Unlock a world of possibilities! Login now and discover the exclusive benefits awaiting you.
- Qlik Community
- :
- Forums
- :
- Groups
- :
- Industry and Topics
- :
- Scalability
- :
- Publisher Analyzer Tool
- Subscribe to RSS Feed
- Mark Topic as New
- Mark Topic as Read
- Float this Topic for Current User
- Bookmark
- Subscribe
- Mute
- Printer Friendly Page
- Feature this Topic
- Mark as New
- Bookmark
- Subscribe
- Mute
- Subscribe to RSS Feed
- Permalink
- Report Inappropriate Content
Publisher Analyzer Tool
A simple QlikView application to analyze reloads in publisher node(s).
High level points of interest shown with the application:
- QVB usage per node
- Resource consumption (RAM/CPU) per node
- If performance counters are enabled (Also attached)
- Success/failures per day, hour task
- Reload durations
- Over time per task
- Step breakdown per reload (Open, reload, save..)
- Top 5
- Slowest
- Most common failures
- Most common exceptions
0.60 addition: Minor bug fix and added support for QlikView 12.x
DISCLAIMER: Use as you wish and please provide feedback, but no support is given to the application
- « Previous Replies
-
- 1
- 2
- Next Replies »
- Mark as New
- Bookmark
- Subscribe
- Mute
- Subscribe to RSS Feed
- Permalink
- Report Inappropriate Content
Thanks Hampus! Great utility!
- Mark as New
- Bookmark
- Subscribe
- Mute
- Subscribe to RSS Feed
- Permalink
- Report Inappropriate Content
its very good utility.
Can we add the processid to the perfmon counters for every QVB spawns. I want to see QVB usage for a particular task/s and i think it can be done if we can pull the QVB rocessid.
- Mark as New
- Bookmark
- Subscribe
- Mute
- Subscribe to RSS Feed
- Permalink
- Report Inappropriate Content
Also in the server utilization Tab can you tell me for CPU utilization what the negative peaks/utilization indicates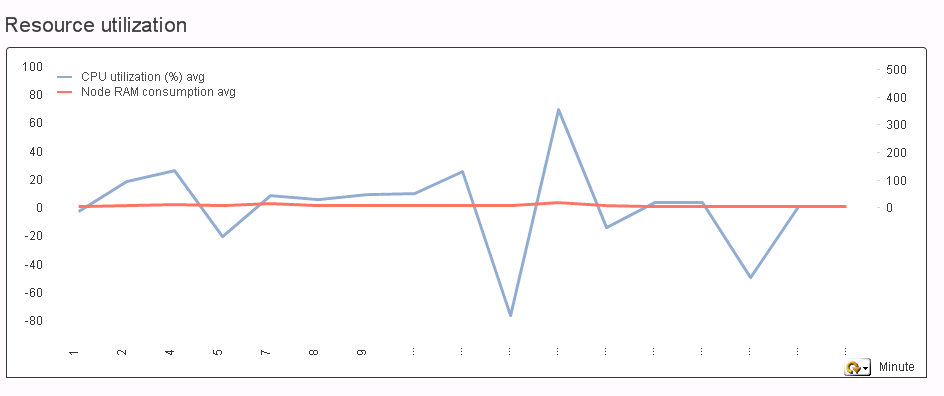
- Mark as New
- Bookmark
- Subscribe
- Mute
- Subscribe to RSS Feed
- Permalink
- Report Inappropriate Content
Hi Chandra,
While it's theoretically possible to do something similar to that it is practically impossible, as each task is not naturally tied to each spawned QVB process. The only way is to add counters for 10K QVB processes and have a formula with an equal amount of processes mapped.
As of 11.2 SR7 these statistics are however printed in the end of each task as a part of "supportability". Check the release notes.
The negative values are due to the fact that the current formula counts CPU usage as; all available minus all IDLE. Sometimes the windows performance counters simply yield the wrong values. I'm sure this could be improved in the application.
You can try changing the CPU utilization (%) formula to this:
=(fabs(max({$<ProcessName={'PROCESS(_TOTAL)'}, ProcessDimension = {'% Processor Time'}>}ServerData))-fabs(avg({$<ProcessName={'PROCESS(IDLE)'}, ProcessDimension = {'% Processor Time'}>}ServerData)))/$(vCores)
Let me know if that helped as I don't have data right now that show negative numbers.
Great that you found it useful.
Regards,
Hampus von Post
- Mark as New
- Bookmark
- Subscribe
- Mute
- Subscribe to RSS Feed
- Permalink
- Report Inappropriate Content
Hello Hampus,
Thanks for clarifications.
I tried with FABS functions and still no difference. Please let me know if you have any thoughts.
Thanks
Chandra
- Mark as New
- Bookmark
- Subscribe
- Mute
- Subscribe to RSS Feed
- Permalink
- Report Inappropriate Content
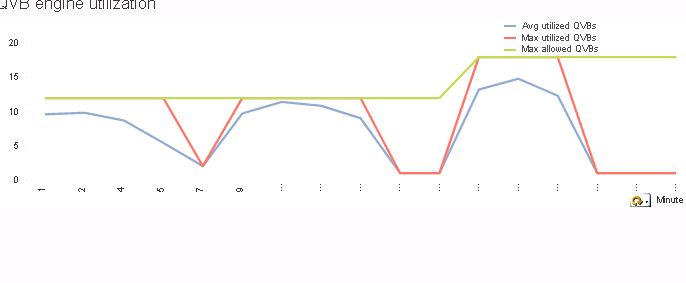
Hampus,
One more question.
why teh max allowed QVB's showing differently for a single set of tasks. I guess teh max allowed QVB's should be consistent across as per the setting in QMC. right.
Thanks
Chandra
- Mark as New
- Bookmark
- Subscribe
- Mute
- Subscribe to RSS Feed
- Permalink
- Report Inappropriate Content
Hi Chandra,
The max allowed is not per individual task, but at some point it was increased from what seems like 12 to 16 parallel QVBs. If you change the chart to per day or similar you can see when the change was done.
And if not changed in the future then that level should be set firm to one value.
Regards,
Hampus von Post
- Mark as New
- Bookmark
- Subscribe
- Mute
- Subscribe to RSS Feed
- Permalink
- Report Inappropriate Content
Got it. sorry Over looked.
Regards
Chandra
- Mark as New
- Bookmark
- Subscribe
- Mute
- Subscribe to RSS Feed
- Permalink
- Report Inappropriate Content
I don't see attachments for performance monitor. What monitors do i need to configure which will show me CPU & Memory utilization on publisher servers. What is it is cluster of 3 QDS servers.
- « Previous Replies
-
- 1
- 2
- Next Replies »