Unlock a world of possibilities! Login now and discover the exclusive benefits awaiting you.
- Qlik Community
- :
- Forums
- :
- Groups
- :
- Industry and Topics
- :
- Scalability
- :
- Re: Qlik Sense Scalability Tool - Failed to get ap...
- Subscribe to RSS Feed
- Mark Topic as New
- Mark Topic as Read
- Float this Topic for Current User
- Bookmark
- Subscribe
- Mute
- Printer Friendly Page
- Feature this Topic
- Mark as New
- Bookmark
- Subscribe
- Mute
- Subscribe to RSS Feed
- Permalink
- Report Inappropriate Content
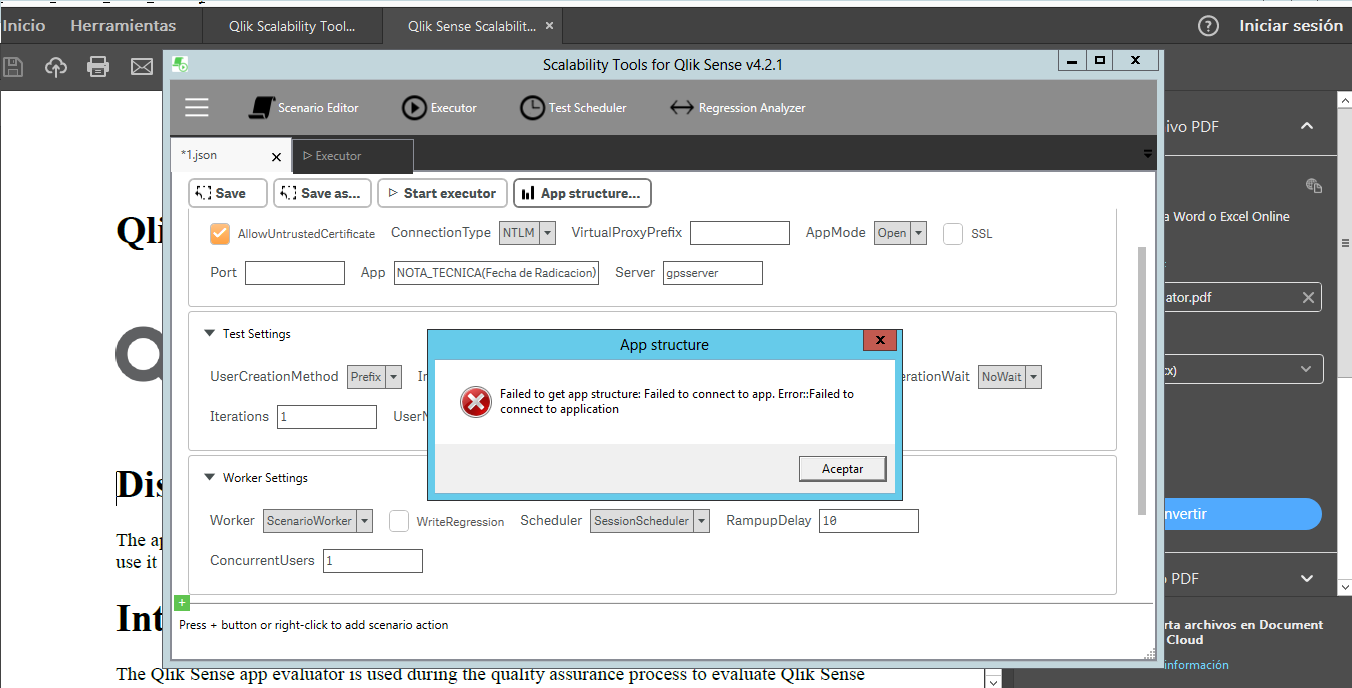
Qlik Sense Scalability Tool - Failed to get app structure: Failed to to connect to app. Error: Failed to connect to application
We have QS Ver 3.1 single-node and can not get the app structure.
This issue is similar to the following Community article:ScalabilityTool assistence needed
Here is what we've tried so far:
- Tried to locally install Tool on same location as Server; no luck.
- Tried to use the JSON file provided in Documentation; no luck.
- Tried a Port Scanner and used Ports open on Server; no luck.
This is the error we get: "Failed to get app structure: Failed to to connect to app. Error: Failed to connect to application"
The error log doesn't provide any insight on what is the issue.
Does anyone have any experience in debugging and getting past this issue?
- « Previous Replies
-
- 1
- 2
- Next Replies »
- Mark as New
- Bookmark
- Subscribe
- Mute
- Subscribe to RSS Feed
- Permalink
- Report Inappropriate Content
Hi,
Almost all cases this is a connection settings issue. Since you don't mention it, did you try the things I mentioned in the first entry in the thread you link? Specifically the first bullet.
dlo wrote:
Hi,
Usually these issues are due to connection settings not being correct, so to first verify:
* Are you able to connect to the app manually using a header user (e.g. using modify headers plugin in firefox)? - (I see you did this, but as a reference to others)
* If you change the script to only be a timerdelay of maybe 10s (i.e. the user will connect to the app, wait 10s and disconnect) do you get any errors or will it connect when you execute it (i.e not "connect to app")?
- Mark as New
- Bookmark
- Subscribe
- Mute
- Subscribe to RSS Feed
- Permalink
- Report Inappropriate Content
Thanks for the quick reply. We tried the Firefox plugin without any luck. Any suggestions on next steps.
- Mark as New
- Bookmark
- Subscribe
- Mute
- Subscribe to RSS Feed
- Permalink
- Report Inappropriate Content
Can you please explain this how to do it ?
Are you able to connect to the app manually using a header user (e.g. using modify headers plugin in firefox)? - (I see you did this, but as a reference to others)
How to connect to app by header ?
- Mark as New
- Bookmark
- Subscribe
- Mute
- Subscribe to RSS Feed
- Permalink
- Report Inappropriate Content
Hi,
You need to download the modify headers plugin to firefox. In the plugin, configure the Name to what you have set up your header to be in your system and give a value (which can be anything). Make sure to enable the plugin and then go the the hub/app using the prefix of the header in the url, example:
https://servername/header/hub
Regards
/Sebastian
- Mark as New
- Bookmark
- Subscribe
- Mute
- Subscribe to RSS Feed
- Permalink
- Report Inappropriate Content
Thanks Sebastian,
It has fixed the issue. One quick question, as I have made a user access rule in QMC as ((user.name like "*"))
so when ST executes it simulates the users and hit the HUB URL and collect logs. I think it tries to check for concurrent user load performance. My Question is , how it consumes tokens correspond to Concurrent user ? of As I have settled 2 concurrent users and it has consumed 5 login passes with NT connection type and Login Pass method.
eventually I want to understand how many token or login passes I need for execution ?
- Mark as New
- Bookmark
- Subscribe
- Mute
- Subscribe to RSS Feed
- Permalink
- Report Inappropriate Content
Hi,
The tool will consumes tokens as a browser, that is in the same way a user would. The total amount of tokens consumed depends on your settings for the scenario: Mainly many concurrent users and amount of iterations you run. Some examples:
If you have 2 concurrent users running only 1 iteration then 2 tokens will be consumed, if they run 2 iterations each then 4 tokens are consumed.
If you want to run time based instead of iterations and have checked "NewUserPerIteration" that means that after a simulated user have completed the scenario it will start again but as a new user - consuming another token. So if you simulate 1 concurrent user with a scenario that takes 1 minute to execute, creating a new user every iteration and running that test for one hour = 60 tokens will be needed. etc etc..
regards
/sebastian
- Mark as New
- Bookmark
- Subscribe
- Mute
- Subscribe to RSS Feed
- Permalink
- Report Inappropriate Content
Your replies are really helful. Can you please explain how you did below thing :
1. Tried a Port Scanner and used Ports open on Server ??
2. Can I have the visualization application of scalability tool in Qlik Sense, for now I need to use Qlik View to view the performance , I don't expect my client has any Qlik View Desktop license ??
- Mark as New
- Bookmark
- Subscribe
- Mute
- Subscribe to RSS Feed
- Permalink
- Report Inappropriate Content
Hi,
1. Well that was not me that wrote that earlier, besides why do you want to check the ports?
2. Yes there is a Sense version of the analyzer as well, found in the same location as the QV version:
- Mark as New
- Bookmark
- Subscribe
- Mute
- Subscribe to RSS Feed
- Permalink
- Report Inappropriate Content
I've tried all the connection options, and they do not work for me.
any ideas?
- « Previous Replies
-
- 1
- 2
- Next Replies »